2018: The Year In Weather, In Minnesota & Wisconsin
The new year is only a few days old but we already know that 2018 brought some impressive, new, all-time weather records to Minnesota and Wisconsin. It was a year of extreme rainfall, extreme snowfall, and continued warming.
MEMORABLE WEATHER EVENTS OF 2018
Before getting into the raw data, let's take a look back at what I consider to be the Most Memorable Weather Events of 2018. Think something else should be added to the list? Connect with me on Facebook or Twitter and tell me what you would add!
- April Blizzard - An all-out weather blitz that began Friday April 13th and continued through the predawn hours of Monday April 16. Friday brought severe thunderstorms with 75-80 mph to Rock and Nobles counties, pea-to-penny sized hail in Le Center, New Ulm, Mankato, and parts of Scott & Dakota counties. A changeover to heavy snow developed from west-to-east across Minnesota through the evening, with whiteout conditions across west-central Minnesota by dinner. Heavy snow, high winds, and whiteout conditions continued across Minnesota and Wisconsin Saturday and Sunday, before ending just after midnight Monday. When it was done, the Twin Cities metro had racked up 15.8" of snow, good for the 12th biggest single-storm accumulation of all time, and areas from Marshall, to Glencoe, to the west and southwest Twin Cities Metro area had 18" to 24" of snow.
- Sizzling Memorial Day Weekend - A heatwave gripped Minnesota and Wisconsin from May 24th through May 29th, peaking with widespread 100°+ high temperatures on Memorial Day, May 28th. That's the day that the Twin Cities recorded it's earliest 100°+ day ever, and only the second 100°+ day ever recorded during the month of May. The six-day stretch of 90°+ heat was also the second-longest on record in the Twin Cities, falling just shy of the eight-consecutive days recorded in 1934. The highest temperature found statewide was 102 at Madison in Lac Qui Parle County, according to the Minnesota State Climatologist.
- Hot & Sweaty Summer - As soon as snow from the April Blizzard melted away, heat returned with a vengeance to Minnesota and Wisconsin. Twin Cities residents experienced the warmest May-to-August stretch on record, A record-long stretch of 107 consecutive days with highs at 70° or above contributed; but, the biggest factor was extremely warm overnight lows, driven mainly by more moisture in the air. This summer was one of the most uncomfortable in several generations, by several different measures.
- August's Smoky Skies - Smoke from Canadian wildfires paid several visits to Minnesota & Wisconsin skies during the month, including from August 10th to 12th, and again on August 17th and 18th. Persistent northwest winds at jet-stream level and the lack of any large-scale weather systems allowed smoke to move in, stagnate, and thicken. Code Orange air quality alerts were issued, indicating poor air quality for sensitive groups of people, including a state-wide alert across Minnesota during the weekend of August 10th to 12th. The smoke was so thick that it actually lowered high temperatures several degrees statewide during that stretch; Twin Cities high temperatures preceding and following that weekend were in the low 90s, but highs were only in the upper 80s on the two smokiest weekend days.
- Soggy & Stormy September - Minnesota and Wisconsin experienced both exceptional rainfall and a terrifying late-season tornado outbreak in September 2018. The first of several rounds of flash flooding during the month developed on September 4th and continued through the 5th, as a slow-moving warm front and ample tropical moisture set the stage for rainfall totals as high as 6 inches in 24 hours in southeastern Minnesota and southwestern Wisconsin. Then, on the afternoon and evening September 20th, a second round of flash flooding and a major severe weather outbreak hit the region. A weeks-long damage survey, undertaken by the National Weather Service, showed that 26 tornadoes struck Minnesota and Wisconsin that evening; the Twin Cities National Weather Service office declared it "Minnesota's third most prolific tornado day (48 on June 17, 2010 and 27 on June 16, 1992)." That system also brought 3.28" of rain to the Twin Cities in 24 hours; the heaviest single-day rainfall total in over 4 years, and the 18th-largest single day rainfall of any day, during any month, going back to 1871. By the end of the month, September rainfall was running 3 to 8" above average across southern Minnesota and Wisconsin.
- Gloomy Autumn - Many peoples' mood matched the skies throughout September, October and November, which the Minnesota State Climatologist said was the "4th gloomiest autumn on record, going back to 1963" in the Twin Cities. The culprit — stubborn low clouds and fog, which allowed for only 18 clear days in the Twin Cities during the three-month stretch, and just two "clear" days during the entire month of November. While November is typically the cloudiest month in the Twin Cities, October, in particular, was much cloudier than normal. And, while long-term hourly sunshine records are harder to come by outside of the metro area, the impact was similar region-wide.
- New All-Time Precipitation Record - We know that a new statewide yearly rainfall record was set in Minnesota in 2018, but we don't yet know which of two leading cities in southeastern Minnesota will take the title. While we wait for final annual precipitation totals, I can tell you that the new record will be declared either in Caledonia (Houston county), or in Harmony (Fillmore County); both cites tallied more than the existing-record of 56.24" in Waseca in 2016.
2018 BY THE NUMBERS
Statewide temperature and precipitation rankings have not been calculated yet, but will be released in the coming days and weeks. In the meantime, looking across Minnesota and Wisconsin, temperatures were largely near-or-below average for many individual cities, and precipitation varied widely.
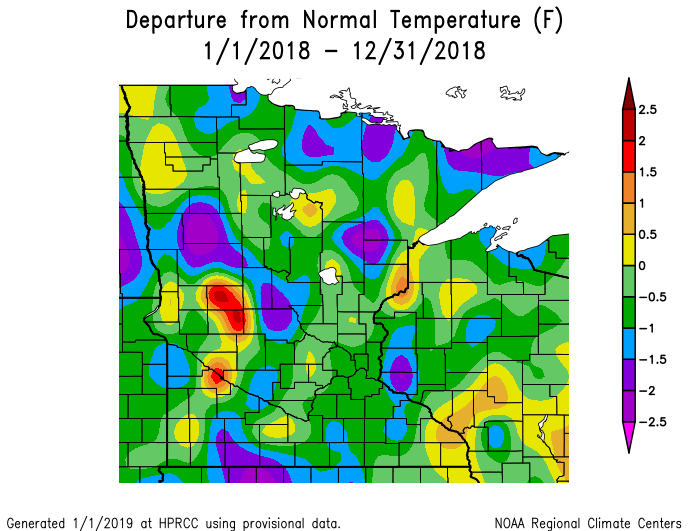
Select areas of Minnesota experienced one of their warmest years on record — Alexandria, MN, for example, experienced its 6th-warmest year in 73 years of continuous record keeping. And, parts of southeastern Minnesota and southwestern Wisconsin averaged 1/2° to 1° above the 30-year climate average for that area — remarkable, when you consider how much precipitation fell there during the year!
Overall, it appears that the state of Minnesota could end 2018 slightly below average statewide; we will know for sure in the coming days.
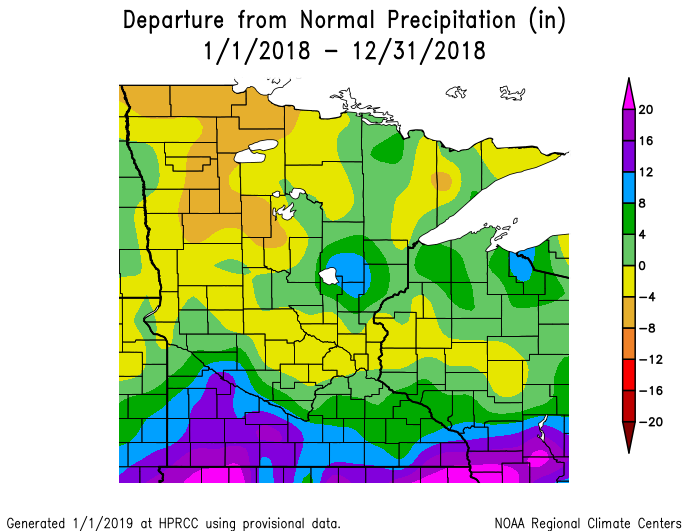
Precipitation-wise, southern parts of Minnesota and Wisconsin were waterlogged for much of the year, while northern Minnesota was parched; in the middle, including the I-94 corridor and areas around the Twin Cities, precipitation was closer to the 30-year average. (Click here for interactive maps showing precipitation figures in 2018.)
Moderate and, at times, severe drought conditions persisted across much of north-central and northwestern Minnesota during the spring and again during the late summer and early fall of 2018.
Heavy, flooding rain fell across parts of southern Minnesota and southern Wisconsin during June, July, September and October 2018; it's no wonder that many cities there experienced one of the top 10 wettest years on record.
.
| CITY | RANK | TOTAL PRECIP. |
PERIOD OF RECORD |
|---|---|---|---|
| Albert Lea, MN (3 SE) | 6 | 43.72 | (1885-2018) |
| Caledonia, MN | 1 | 57.97 | (1892-2019) |
| Harmony, MN | 1 | 57.27 | (1939-2018) |
| La Crescent, MN (Dam 7) | 1 | 48.47 | (1939-2018) |
| La Crosse, WI Area | 5 | 42.59 | (1872-2018) |
| Marshall, MN | 2 | 40.48 | (1935-2018) |
| Mora, MN | 8 | 37.34 | (1904-2018) |
| Red Wing, MN (Dam 3) | 7 | 36.87 | (1948-2018) |
| Redwood Falls, MN Area | 6 | 34.77 | (1892-2018) |
| Twin Cities Area | 27 | 33.58 | (1871-2018) |
| Winona, MN (Dam 5A) | 6 | 40.95 | (1939-2018) |
| Worthington, MN Area | 1 | 43.49 | (1893-2018) |
.
IN THE TWIN CITIES
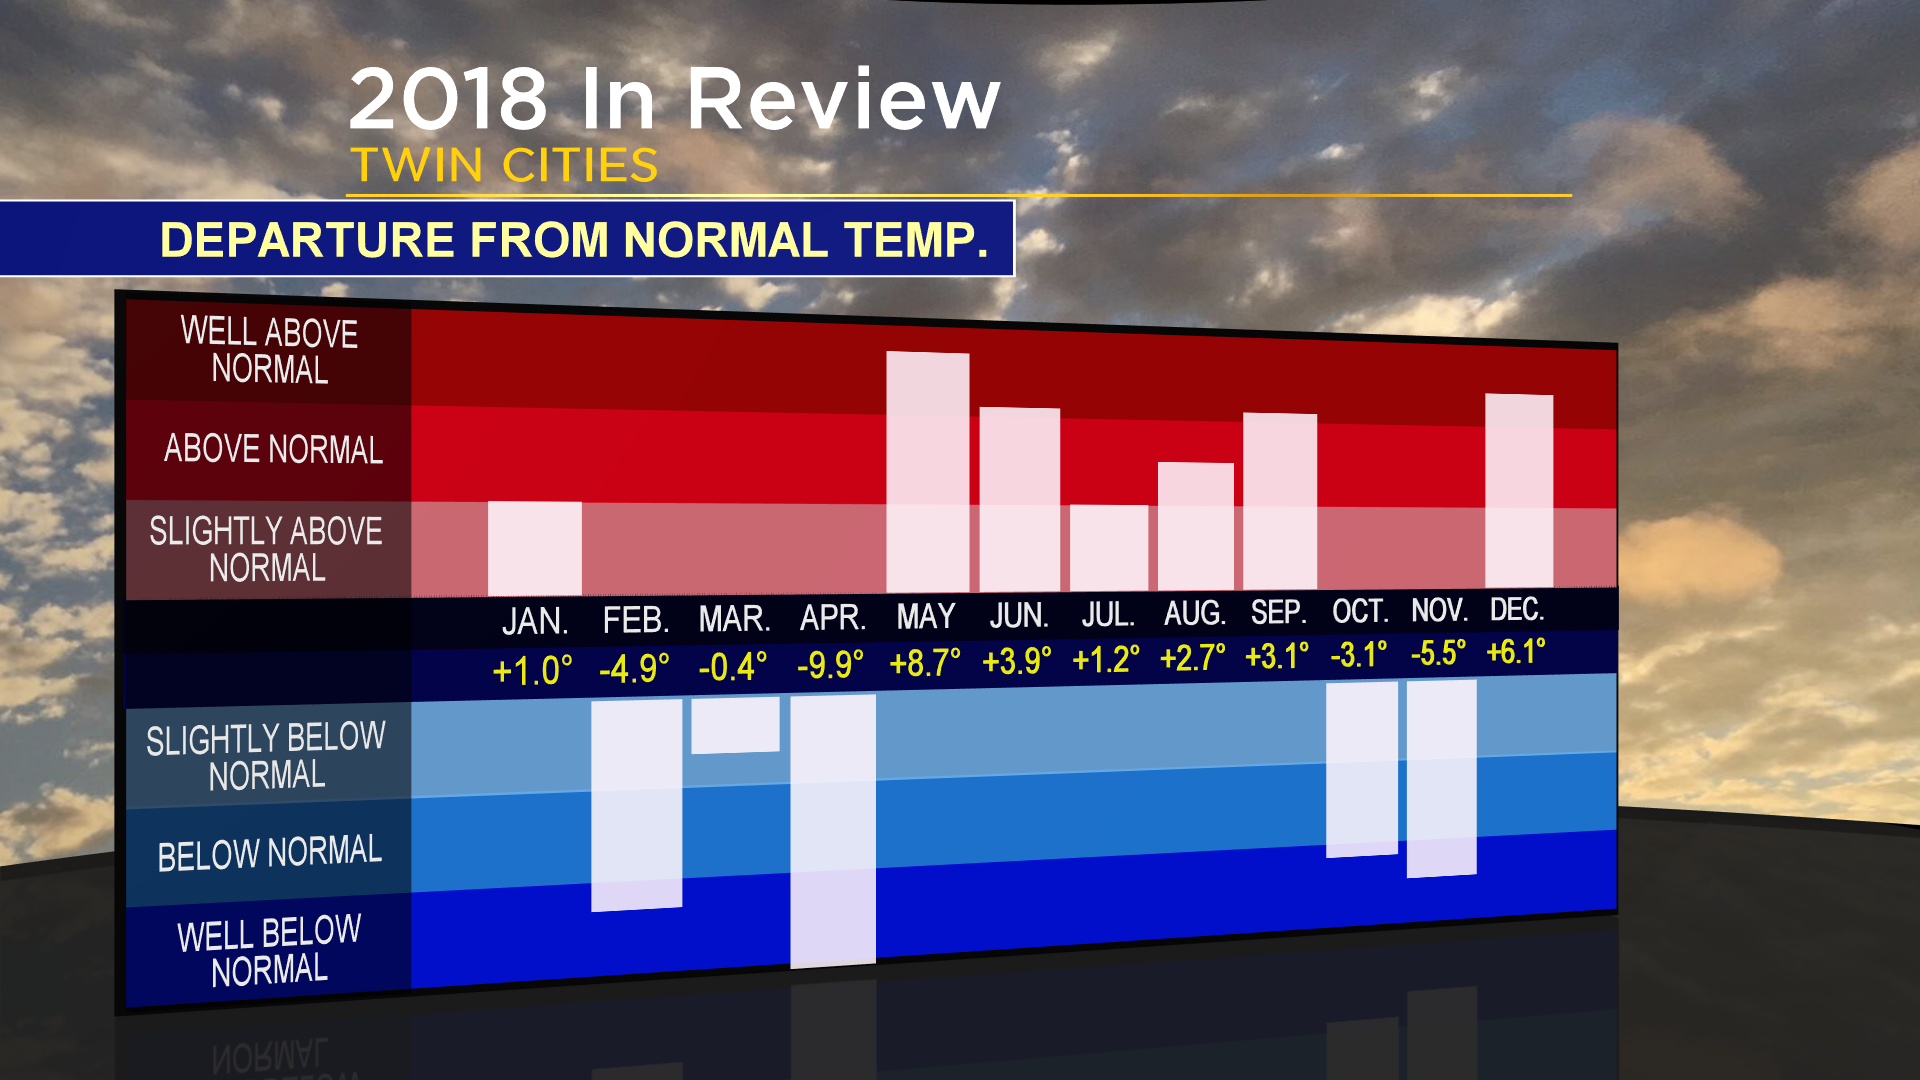
In the aggregate, the Twin Cities Metro area finished 2018 pretty close to average, in terms of both temperature and precipitation. When the final numbers are in, the year will likely be about 0.3° colder than the 30-year climate average, and about 10% wetter than the average.
Still, the remarkably wet month of September stands out, as does the light-switch change from very cold to very warm in April and May.

Keep in mind that these data are considered preliminary; while slight adjustments are possible in the coming months, those changes are not likely to have a significant impact on the overall character of the year. Data are from the National Oceanic and Atmospheric Administration and was compiled from a variety of sources including the Minnesota State Climatology Office, the High Plains Regional Climate Center, Midwestern Regional Climate Center, and the Southeast Regional Climate Center.
Global temperature data for 2018 are expected to be released in mid January 2019, and we'll provide an update when that happens, too. Despite the lack of a strong El Nino — a pattern of ocean warming that has helped push global surface temperatures to record levels in the last several years — it is still looking highly likely that 2018 will be one of the 10 warmest years on record, globally.
Stay tuned.


