Hillary Clinton gaining support among key set of voters
By Sarah Dutton, Jennifer De Pinto, Fred Backus and Anthony Salvanto
Hillary Clinton now leads Donald Trump by four points (45 percent to 41 percent) in a four-way race for president. About one in 10 voters pick either Gary Johnson (8 percent) or Jill Stein (3 percent). In a head to head match-up without third party candidates, Clinton leads by six points.
Eight in 10 of both Trump and Clinton supporters will be upset and worry about the future of the country if the other candidate becomes president.
Clinton has improved on some key candidate qualities: More now see her as having the right temperament (59 percent) and being prepared to be president (63 percent) than at any time during the campaign. Trump’s numbers have held steady on these measures and continue to be negative. But he is seen as best able to handle the economy and bring change.
While overall views of the candidates remain negative, Clinton’s favorable rating has increased a bit to 39 percent – the highest since July of last year.
As the controversy over a beauty pageant winner continues, voters are more likely to say Clinton (72 percent) rather than Trump (41 percent) cares about the needs and problems of women.
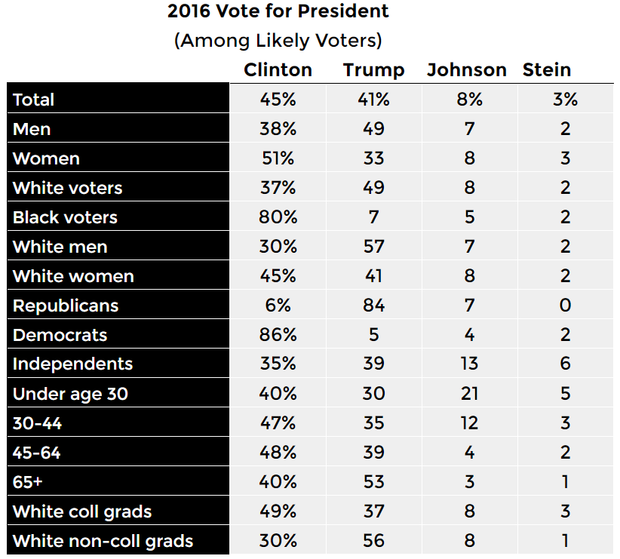
The State of the Race
In the first CBS News Poll following last week’s presidential debate between Hillary Clinton and Donald Trump, Clinton has edged ahead to a four-point lead over her Republican rival among likely voters. Forty-five percent of likely voters support or lean towards Hillary Clinton, while 41 percent support Donald Trump. Libertarian candidate Gary Johnson gets 8 percent of likely voters, while Green Party candidate Jill Stein receives just 3 percent of the vote. Before the debate the two leading candidates were tied in a four-person race at 42 percent each.

Hillary Clinton extends her lead further in a direct head-to-head comparison. In a two-way match-up where third party candidates are not named explicitly, Hillary Clinton leads Donald Trump 49 percent to 43 percent among likely voters, including leaners.
Voters Worry about Other Candidate Winning
Each candidate’s supporters would be upset if the other candidate won the presidency. Eighty-one percent of Clinton voters say they would be upset and worry about the direction of the country should Trump become president. A similar percentage of Trump voters – 79 percent – would be upset if Clinton were to become president.
The First Debate
On balance, the recent presidential debate has had a more positive impact on views of Clinton than on views of Trump. Likely voters who watched the first presidential debate are twice as likely to say the debate made them think better of Clinton (32 percent) than worse (16 percent). For Trump, the reverse is true. Only 10 percent of voters who watched the debate say it made them think better of him, while 36 percent say it made their opinion of him worse. For about half of likely voters the debate had no effect on their impressions of the candidates.
Far more Democratic voters (58 percent) than Republican voters (22 percent) say the image of their candidate improved after the debate.
Views of the Candidates and Qualities
The candidates continue to be viewed more negatively than positively overall, but Clinton’s favorable rating has increased slightly from earlier this month. Thirty-nine percent of voters now have a favorable view of her (far short of a majority), but up four points from before the debate and her highest favorable rating since July of last year.
Overall impressions of Trump have not changed much. A third of voters have a favorable view of him, while 55 percent view him unfavorably.
Evaluations of Clinton on some candidate qualities have grown slightly more positive, while assessments of Trump have held steady. Clinton continues to have an advantage on temperament and preparedness. Fifty-nine percent of voters think she has the right temperament and 63 percent think she is prepared to be president – her highest marks on these traits during this campaign.
As has been the case for months, majorities of voters don’t think either candidate is honest and trustworthy.
More voters continue to see Trump as someone who can bring change to Washington, but Clinton’s numbers have improved on this measure as well.

Most voters think the candidates have a vision of where they want to lead the country, but fewer than half agree with each of those visions. Not surprisingly, views are impacted by partisanship. Majorities of Democrats say Clinton has a vision for the country and agree with it, while Republicans are more inclined to say she doesn’t have a vision or disagree with it. On the flip side, Republicans agree with Trump’s vision for the country, while Democrats do not.
Women
In a four way race, Hillary Clinton enjoys strong support from women; she now leads Trump by 18 points. Trump maintains an 11 point lead among men. (see page 9 for full demographic table)
In the aftermath of the candidates’ statements about a former Miss Universe, by a large margin voters are more likely to say Clinton (72 percent) rather than Trump (41 percent) cares at least some about the needs and problems of women.
Similarly, women voters themselves are far more likely to say Clinton (76 percent) cares at least some about women than say that about Trump (34 percent). Forty-eight percent of women voters say Trump doesn’t care at all about the problems of women.
There are differences by party, however. Large majorities of Democratic (96 percent) and independent women (72 percent) say Clinton cares about their needs and problems, but fewer Republican women (46 percent) think that. Most Republican women (76 percent) say Trump does care about the needs and problems of women.

When voters are asked to pick the candidate quality that will matter most in their vote for president, bringing change tops the list (28 percent), followed by the right experience (20 percent). Further down the list are honesty and trustworthiness (18 percent), caring about people like you (16 percent) and having the right temperament (8 percent).
Change is a clear priority for Trump voters, while Clinton voters see having the right experience as being most important. Honesty is more important to Trump’s supporters than Clinton’s, while empathy and temperament are viewed as more essential to Clinton backers.
Candidates on the Issues
Clinton leads Trump on handling a number of issues. By large margins, voters think she would do better at handling foreign policy and race relations, and she has advantage on immigration as well. Slightly more voters think he would do better at handling the economy and jobs and reducing crime; the two candidates are close on managing ISIS and international trade.

Key Issues: Clinton vs. Trump Voters
In a sign of the country’s political polarization, Clinton and Trump voters hold very different views on major issues facing the country. Trump voters hold more pessimistic views on international trade than Clinton voters, and the two sets of voters are at odds on immigration, energy policy and ISIS.
Jobs and Trade
Trump voters are much more likely than Clinton voters to say that international trade costs the U.S. jobs. Clinton voters are more likely to see potential job growth in alternative energy such as wind and solar power, while Trump voters think more jobs would be created through increasing domestic production of fossil fuels such as oil and gas.
Half of Clinton supporters say their family’s financial situation is better now than it was four years ago – but only 13 percent of Trump voters say the same.

Immigration
Nearly four in five Clinton supporters think illegal immigrants should be permitted to stay in the U.S. and apply for citizenship, but half of Trump voters think they should be deported.
Eighty-three percent of Clinton voters think refugees from Syria should be allowed into the U.S. as long as they go through a security clearance process, while 62 percent of Trump voters think they should not be allowed into the country at this time.
ISIS
Sixty percent of Clinton voters think the fight against the militant group ISIS is going well, while 88 percent of Trump supporters think it is going badly.
Race
Both sets of voters agree that race relations are generally bad now. Trump voters are more apt than Clinton voters to say quality of life for both white and black Americans is worsening.
Cyber Attacks
Clinton and Trump voters also agree that the threat of cyber attacks is a very serious problem, and majorities think the U.S. is not adequately prepared to deal with a major attack. Trump voters are more likely to be skeptical of the country’s preparedness.

President Obama
President Obama’s job approval rating among Americans overall is now 55 percent – the highest of his second term. After hovering in the 40s throughout much of the previous five years, the President’s approval rating has been above 50 percent for the past few months. Among registered voters, his approval rating is more positive than negative, with 51 percent approving and 43 percent disapproving.

Fifty-two percent of Americans approve of how he is handling the economy – which 56 percent rate as good. Twenty-nine percent think it is getting better, while 25 percent think it is getting worse, and 45 percent think it’s staying the same.
Evaluations of the President’s handling of foreign policy are more negative: just 43 percent of the public approve, and slightly more, 45 percent, disapprove.
And 35 percent of Americans think the country is going in the right direction – the highest that has been since February 2015. Still, far more, 60 percent, think it is headed off on the wrong track.
Who’s Supporting Whom?
Hillary Clinton enjoys strong support from women; she now leads Trump by 18 points. Trump maintains an 11-point lead among men.
Trump holds a 12-point lead among white voters overall, and an even larger lead among white men. Clinton has an edge among white women. Trump continues to trail among blacks, eight in 10 of whom are voting for Clinton.
Trump has a 13-point lead among seniors, but Clinton now holds a lead among voters of all age groups under 65. Clinton continues to struggle with voters under 30 years of age – beating Trump by 10 points among this group but getting just 40 percent of their vote overall. About one in four are voting for either Gary Johnson (21 percent) or Jill Stein (5 percent).
Whites without a college degree are strong supporters of Trump (56 percent back him), while Clinton leads Trump among white voters with a college degree. Trump and Clinton continue to hold similarly commanding leads among members of their own parties, while Trump holds a slight edge among independents.
.
This poll was conducted by telephone September 28-October 2, 2016 among a random sample of 1,501 adults nationwide, including 1,217 registered voters. Data collection was conducted on behalf of CBS News by SSRS of Media, PA. Phone numbers were dialed from samples of both standard land-line and cell phones.
The poll employed a random digit dial methodology. For the landline sample, a respondent was randomly selected from all adults in the household. For the cell sample, interviews were conducted with the person who answered the phone.
Interviews were conducted in English and Spanish using live interviewers. The data have been weighted to reflect U.S. Census figures on demographic variables.
The error due to sampling for results based on the entire sample and the sample of registered voters could be plus or minus three percentage points. The error for subgroups may be higher and is available by request. The margin of error includes the effects of standard weighting procedures which enlarge sampling error slightly.
The sample of likely voters is modeled among registered voters (N=1217), assigning each respondent a probability of voting based on their responses. The margin of error for the sample of likely voters is plus or minus four points. This poll release conforms to the Standards of Disclosure of the National Council on Public Polls.