3 reasons stocks look shaky
Equities continued their march higher on Tuesday in what was a quiet session of trading. This after the Federal Reserve confirmed last week that any interest rate hike was unlikely before September at the earliest.
Volatility in Chinese markets was largely ignored after the Shanghai Composite posted a big dump-and-pump in the overnight session, dropping as much as 4.7 percent before finishing with a 2.2 percent gain. The index is down nearly 12 percent from its recent high in what is its first excursion below its 50-day moving average since February.
Instead, focus remained on the situation in Europe as Greece's recently unveiled bailout proposal -- which mainly consists of large tax increases and pension contributions -- is analyzed by creditors with just days left before a $1.8 billion payment to the International Monetary Fund comes due.
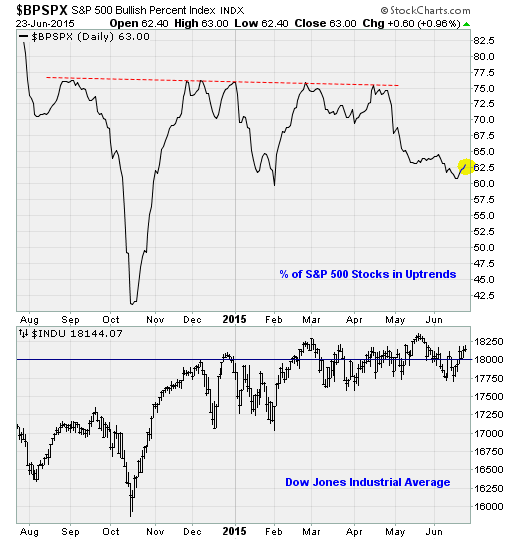
On the surface, it looks like stocks are taking all of this in stride. Technically, stocks remain range bound near the 18,000 level on the Dow Jones industrial average a level first touched back in December. But warnings signs are starting to accumulate. Here are three to watch out for:
Waning demand
We're a couple of weeks away from the start of the second-quarter earnings season. That means the flow of corporate buybacks, a powerful source of buying demand for stocks lately, will slow. Bank of America Merrill Lynch analysts also note that institutional traders are selling heavily, with net sales of $4.1 billion last week, the largest offloading of equities since the financial firm started tracking the data in 2008.
This isn't anything new. Meanwhile, market breadth -- the percentage of stocks moving to the upside -- has been weakening since late April as buyers become focused on a narrowing group of stocks to hold the Dow aloft.
Sentimental journey
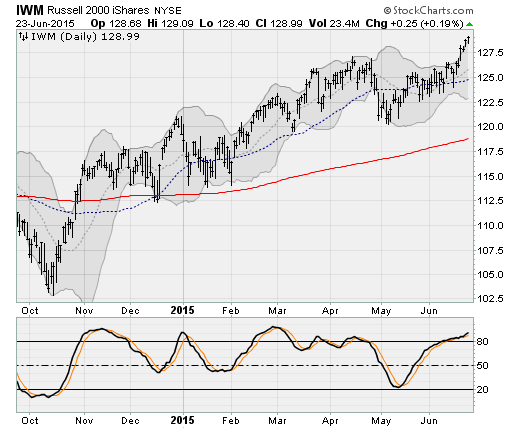
As investor demand for stock wanes, optimism towards small-cap stocks in the Russell 2000 iShares (IWM), which has been leading the large-caps in the Dow, has reached an extreme not seen since January 2014, according to Jason Goepfert at SentimenTrader. Over the last five years this has happened 35 other times. Over the month that followed, the IWM posted a median return of -2 percent, with a maximum loss of -4.1 percent versus a maximum gain of 1.9 percent.
Protection ignored
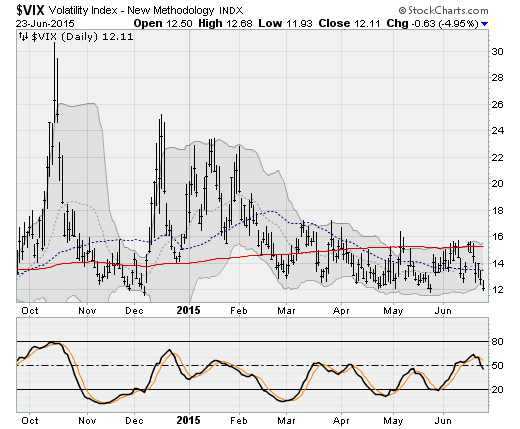
Finally, options traders no longer feel the need to pay up for put option protection against a possible market decline, perhaps triggered by a breakdown in Greek debt talks. This can be seen in the precipitous decline in the CBOE Volatility Index (VIX) -- known as Wall Street's "fear gauge" -- over the past few weeks.
Goepfert notes that when the VIX has reached lows near current levels, the measure has rebounded over the following week 26 out of 28 times for an average increase of 14 percent. Over the next three weeks, the VIX was higher 27 times including every occurrence since 1994 with an average gain of 22 percent at its best point versus an average loss of 1.5 percent at its worst.
In other words, the VIX's decline reflects a strong sense of investor complacency that rarely lasts for too long.
Combined, these factors suggests a growing risk of a surprise stock market selloff over the next month that could be caused by any number of catalysts: a Greek debt default, the start of corporate earnings season, the July Fed policy meeting and more. Investors would do well to stay on their toes.