Unlawful immigrants make up smaller -- not larger -- share of U.S. workforce
With immigration taking a front seat in the U.S. presidential election, some voters may be wondering just how many unauthorized immigrants are working in the American labor market.
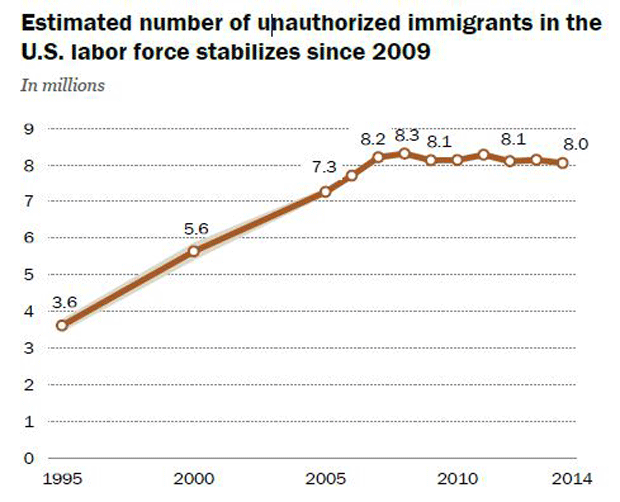
The answer: Not as many as there were in 2008, according to new research from the Pew Research Center, which analyzed data from the U.S. Census Bureau.
About 8 million unauthorized workers held jobs in the U.S. labor force in 2014, down from 8.3 million in 2008, during the recession, and 8.1 million in 2009. Since 2009, the American labor force -- or workers who were born in the U.S. or are lawful immigrants working here -- has expanded by 2.2 percent, which means unlawful immigrants are making up a smaller share of the labor force than they did in 2009.
Republican candidate Donald Trump has focused on immigration as one of his top policy issues, saying that enforcing stricter regulations will boost wages and “ensure that open jobs are offered to American workers first.” Trump also insists as president he’d build a wall across the border with Mexico, even though, as Pew found in a September report, the number of unauthorized Mexicans living in the U.S. has declined by about 500,000 since 2009.
With the rhetoric heating up about immigration, there are some widespread misperceptions about unauthorized immigrants, said Pew demographer Jeffrey Passel. “I’ve described the discussion as fact-free,” he said. “This notion that they are doing jobs that Americans want to do doesn’t show up in our data.”
Unauthorized immigrant workers tend to concentrate within a few industries, such as agriculture and construction, Pew found. But even the occupations with the largest share of unauthorized immigrant workers -- such as drywall installers, where unauthorized immigrants comprise 31 percent of all workers -- still had a much larger share of native-born employees.
“There’s no evidence that they “take jobs” from natives,” Passel said. “The major consequence is expanding the labor market, and expanding the economy. To the extent that there are groups out there that are affected by new immigrants, the main one is the previous immigrants.”
In some occupations, immigrants are filling in roles where native-born workers have retired, or they are finding work in occupations that aren’t as appealing to U.S.-born workers, who typically have the means to find more job opportunities than illegal immigrants. Not surprisingly, unauthorized immigrants tend to work in low-skilled occupations, which is likely due to a lack of education as well as language barriers and the difficulty in finding other work because of their legal status.
So where are unauthorized immigrants coming from? Mexicans make up the biggest slice of the pie, despite their declining numbers. About 5.85 million unauthorized immigrants are from Mexico, compared with 700,000 from El Salvador, which is the second most likely country of birth for unauthorized immigrants. The country representing the biggest increase in unauthorized immigrants since 2009 is India, Pew found earlier this year. Since 2009, there has been an increase in unauthorized immigrants coming from China, Guatemala, and, lastly, Canada.
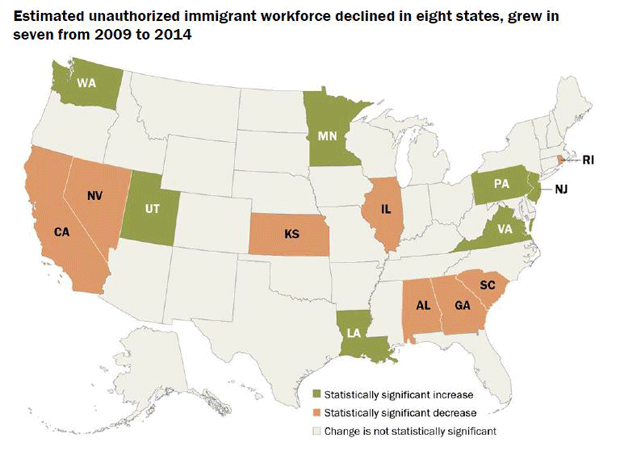
The ranks of unauthorized workers declined in eight U.S. states from 2009 to 2014, including California, Georgia and South Carolina, while seven states witnessed increases in the number of unauthorized immigrants in their labor forces, including Pennsylvania and New Jersey, Pew found.
Below are the 10 occupations with the highest share of unauthorized immigrant workers in 2014, according to Pew’s analysis of the latest available data.
1. Drywall installers (31 percent of drywall installers are unauthorized immigrants)
2. Miscellaneous agricultural workers (30 percent)
3. Roofers (29 percent)
4. Painters, construction and maintenance (26 percent)
5. Brickmasons, block masons and stonemasons (25 percent)
6. Maids, housekeepers and cleaners (24 percent)
7. Carpet, floor and tile installers and finishers (24 percent)
8. Sewing machine operators (23 percent)
9. Construction laborers (21 percent)
10. Grounds maintenance workers (20 percent)