How CBS News estimates whether House races will be competitive in 2018
Every election year is different, but not always that different -- especially with the House of Representatives. Historically, most districts tend to stay with whichever party holds them. The vast majority of incumbents are re-elected, and even when the House majority changes hands, it's a result of fewer than 20 percent of district flipping. So we can use a lot of known factors to gauge which districts could be competitive this year -- even before all the candidates are decided -- and we can also show you why you ought to look district by district, rather than simply tracking national numbers.
We've analyzed more than a decade's worth of House voting patterns, looking at trends in every district's past vote and how similar districts have behaved, and incorporated current characteristics and political factors for each. All this tells us that there are likely to be more than enough competitive districts to put the House into play.
For each of the 435 House districts, our current, early-look model includes the following information:
- Which party controls the seat now? Seats rarely change parties. In fact, it's only happened in about 6 percent of races since 2002.
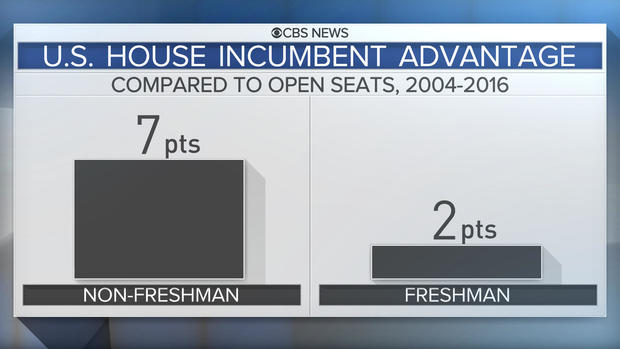
- Is the incumbent is running for reelection, and if so, is he or she is a freshman? Incumbents tend to have the upper hand. Since 2004, the parties have done seven points better when they had an incumbent running than when the race was open. However, this advantage is a much more modest two points among incumbents serving their first term in Congress (a.k.a. "freshmen").
What was each party's vote share in recent House elections? How a party did in the last election is a good predictor of how they will do now: all else equal, the typical district swings by less than five points in either direction from one election to the next.
- What was each party's vote share in recent presidential elections? Knowing how many votes went to each presidential candidate in a district helps predict how competitive it will be. However, it is not as informative as the past congressional vote, particularly when incumbents run for reelection. This year, Democrats may be targeting 23 Republican-held districts that Hillary Clinton won in 2016, but some are held by Republicans whose incumbency advantage will be substantial. In some of these districts, voters are clearly willing to send a Republican to the House, despite trends in national or statewide elections. We take this into account.
The estimates serve as a baseline pre-primaries. We combine them with qualitative judgments based on local factors, such as candidate recruitment, fundraising, and district demographics.
A breakdown of CBS News' current House district ratings, is here.
The current environment and generic ballot
Our model uses district-by-district measures, but you may see a lot of talk about the "generic ballot" -- that refers to polls that ask whether people would back a Democrat or Republican for Congress. These "generic ballot" polls don't name individual candidates and usually don't estimate any district in particular. The House of course is decided in 435 separate elections, not a national one. So think of the generic ballot as a nice-to-know gauge of the nation's mood, but not a direct measure of how many specific seats might flip.
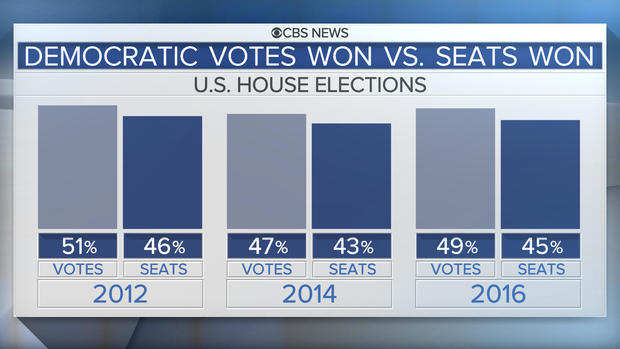
Recent national polls have shown the Democrats with a generic ballot lead. For context, in recent years, the Democrats have typically won a smaller percentage of seats than their share of the national vote. In 2012, for instance, Democrats won 51 percent votes nationally, but only 46 percent of House races.
One reason for this is that most of the national Congressional vote – and therefore, most of what's being measured in the generic ballot in advance of it – comes from "safe" districts that very rarely change parties. On average, both Democrats and Republicans win their districts with more than 60 percent of the vote. Most of the national vote and generic ballot is made up of these kinds of votes. Even if the polls pick up movement of a few points in these places, it won't be enough to change the winner in districts like that, and all you're left with are fluctuations that don't translate into actual seat flips.
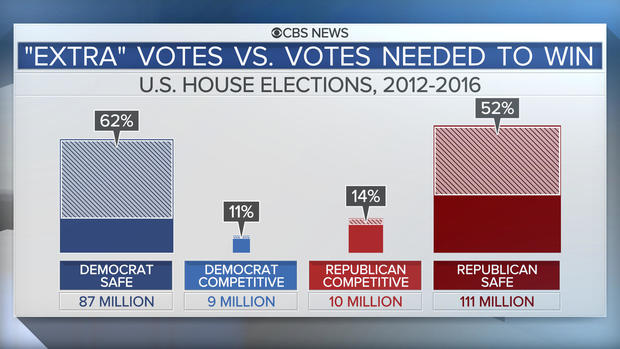
We can compute the sizable number of these "extra" votes that are cast nationally. These are votes that don't determine seat flips, because they go beyond what a party needed to win a race. Democrats end up with a disproportionate share of extra votes, due to a combination of factors, including the clustering of Democratic voters in urban areas and partisan gerrymandering. In the last three general elections, 62 percent of Democratic votes in safe Democratic districts were extra votes. As for Republican extra votes, the number was 52 percent in safe Republican districts. In competitive districts, margins of victory tend to be smaller, so there are fewer extra votes.
The key thing to watch is movement within the competitive seats, and the number of competitive seats in play. That is, for the House to be in play, you need to see substantially more competitive seats than the gap between the parties. This year, there is a gap of 24 seats and well over 40 seats in play. The longer the list grows, the better chance there is of the House majority changing. That's because about half of competitive seats get close but don't actually flip, unless there's a wave -- and the hallmark of a wave election is one in which more than half of those seats flip.


