The 10 best green cities for families

Americans are more concerned about the environment than ever before. In a Gallup poll released earlier this year 64 percent of respondents said that they worry about global warming a "fair amount" or a "great deal." Nearly 60 percent said that the effects of global warming have already begun, while another 31 percent believe that it will eventually.
Those responses communicate a key element of climate change and environmental degradation in general: It takes time to develop and can burden people who did not cause it in the first place. For that reason, the health of the environment is of particular importance to many parents, who want want their children to enjoy clean water, clean air and a stable climate throughout their lives.
To find the best green cities for families, SmartAsset analyzed data on 327 of the largest cities in the U.S. from sources such as the Environmental Protection Agency, the U.S. Department of Agriculture and the Census Bureau. For each city, we considered eleven metrics in total. Six of these were reflective of a city's level of environmental friendliness, including the average household carbon emissions, the percentage of commuters who do not drive to work alone and the number of farmers markets.
The remaining five data points included things like the crime rate, the unemployment rate and the cost of housing, which measure the overall quality of life for families in each city.
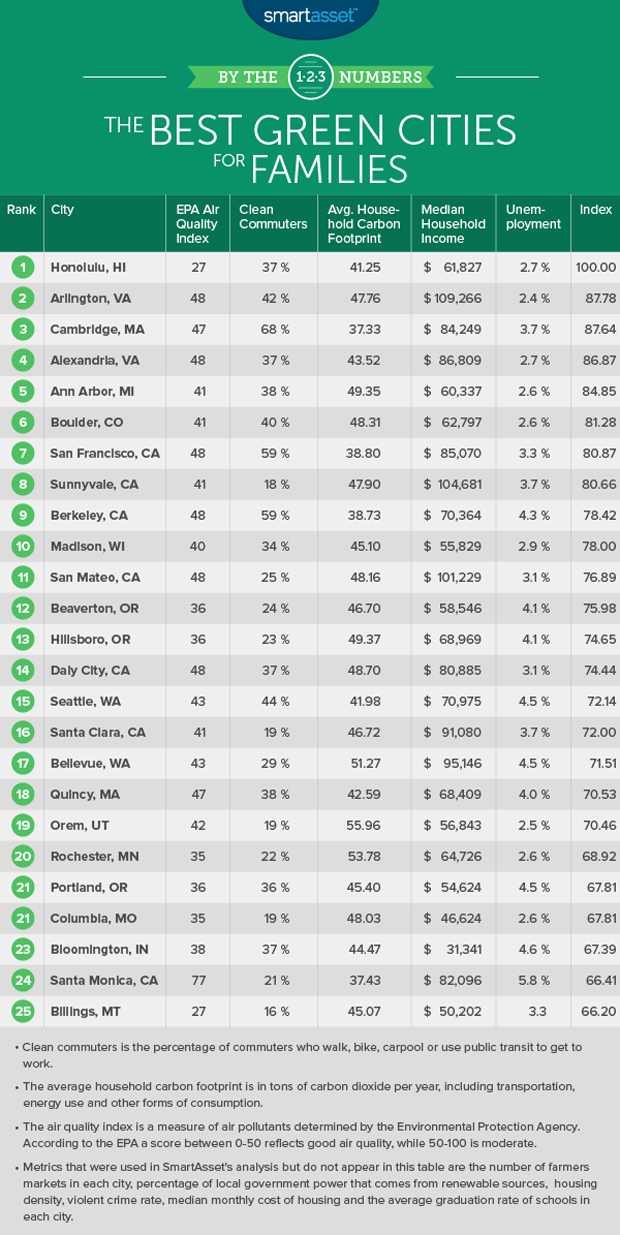
Click ahead for a look at the 10 best green cities for families.
- Top 10 cities for working parents
- The average retirement age in every state
- The happiest places in America
(Click here for a look at the full methodology and data sources .)
1. Honolulu, Hawaii
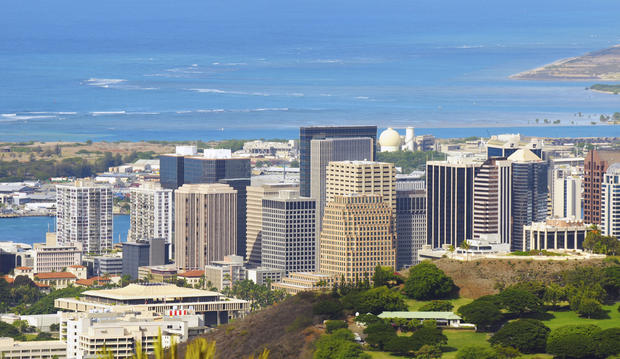
Looking for clean air? Honolulu is the place to be. The Hawaiian capital city's EPA air quality index of 27 rates as third best out of the more than 320 cities in SmartAsset's study. That's not the only reason Honolulu is the best green city for families, however.
The city also ranks among the top 50 for the average household carbon footprint, which is 41.25 tons of carbon dioxide per year. Working parents will also appreciate the city's low unemployment rate, which is just 2.7 percent.
2. Arlington, Virginia
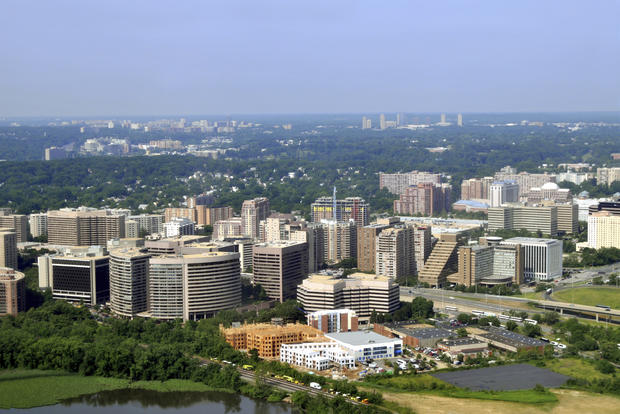
Nearly 42 percent of all workers in Arlington use some form of clean transportation to get to work, the 13th-highest clean-commuter percentage of any city in SmartAsset's study. About 27 percent commute by public transit, many of them using the D.C. metro system. In most cities, about 80 percent of workers commute by driving alone, which consumes more energy and has a greater impact on the environment.
Arlington also boasts a very high quality of life. The unemployment rate of 2.4 percent ranks as the third-lowest of any city in SmartAsset's analysis, while the violent crime rate is 24th-lowest.
3. Cambridge, Massachusetts

The average annual household carbon footprint in Cambridge is just 37.33 metric tons per person. That ranks as the ninth-lowest of any city in SmartAsset's study. Why is it so low? For starters, Cambridge is one of the densest cities in America, with more than 17,000 residents per square mile.
Secondly, very few commuters in Cambridge drive alone to work. In fact, 68 percent of commuters in the city walk, bike, use transit or carpool. Of the 327 cities in our study, that ranks second (New York City is first).
4. Alexandria, Virginia
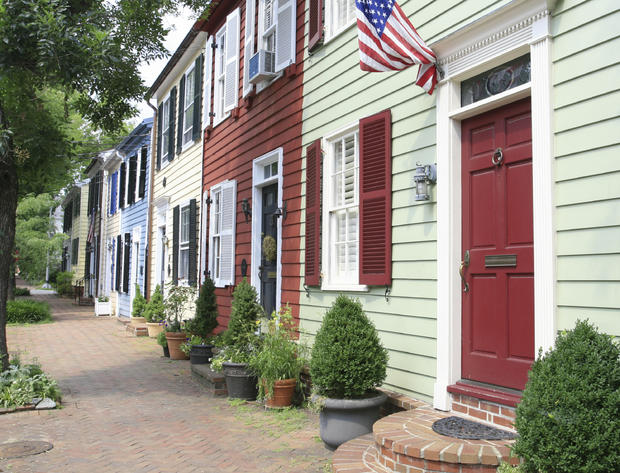
The city of Alexandria is a participant in the EPA's Green Power Partnership program, which works with local governments that receive some percentage of their energy from renewable sources such as solar and wind. Alexandria receives 19 percent of its power from such sources, which rates as the 26th highest among the cities in SmartAsset's analysis.
5. Ann Arbor, Michigan

Ann Arbor's green reputation is well-deserved. The city has had a recycling program since the 1970s, making it one of the first major cities in the U.S. to introduce such a program. Nearly 38 percent of workers in the city commute in an environmentally-friendly manner, the 20th-highest ratio of clean commuters in SmartAsset's study.
Families will also find that, outside of its environmental virtues, Ann Arbor is a great place to live. The unemployment rate is just 2.6 percent and the average graduation rate at local high schools is more than 86 percent.
6. Boulder, Colorado
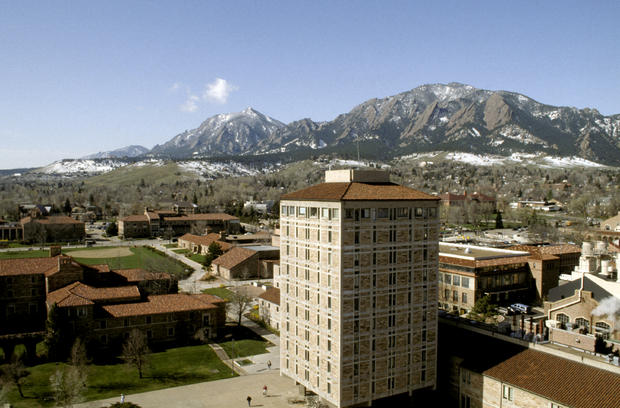
The city of Boulder has set the admirable goal of becoming a zero waste community. Technically this means diverting and reusing 85 percent of all waste (the international standard for defining a zero waste city). Though currently about 34 percent of waste in Boulder is diverted, the city aims to reach that 85 percent level by 2025.
That isn't the only thing that makes Boulder a top green city and a great place to live: It also rates well for the percentage of commuters who use some form of environmentally-friendly transportation to get to work. At 40 percent, it ranks 17th in our analysis for that measure.
7. San Francisco, California

The population density of a city significantly effects the environmental footprint of the populace. Dense cities consume fewer resources (on a per capita basis) and can rely on environmentally-friendly modes of transportation like busses and bikes. San Francisco has a population density of more than 18,000 people per square mile, second in the country only to New York City (among major cities).
The city also has 23 different farmers markets, according to data from the U.S. Department of Agriculture. That is the sixth-highest number of farmers markets of any city in our study.
8. Sunnyvale, California
Located north of San Jose in Silicon Valley, Sunnyvale combines a strong economy with good schools and low crime. It rates as one of the safest cities in America. While it is a relatively small city, it has a population density of more than 6,800. That ranks 50th of the more than 320 cities in SmartAsset's study.
9. Berkeley, California

Home to the flagship campus of the University of California, Berkeley has long been a center of environmental research and progress. For example, researchers at the university's CoolClimate Network have mapped out the carbon footprint of every household in America.
On that measure, the city of Berkeley rates quite well. The average household carbon emissions per year in Berkeley is 38.7 metric tons per year. That is 20th lowest of the 320 cities in SmartAsset's study. One driving factor for that small carbon footprint may be the manner in which Berkeley residents get to work. Nearly 60 percent do not drive alone, the fifth-highest percentage of clean commuters in our study.
10. Madison, Wisconsin
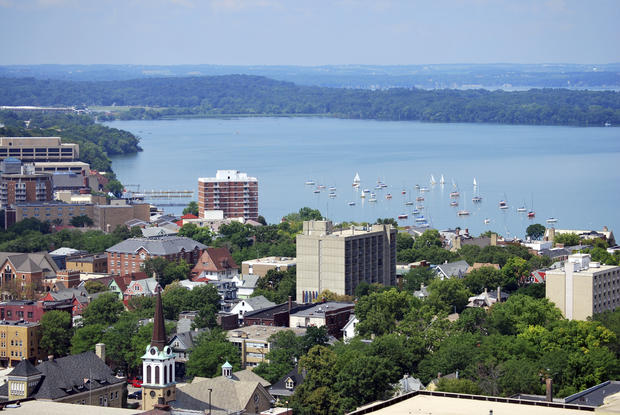
According to the U.S. Department of Agriculture, the Wisconsin capital is home to 12 different farmers markets. That's the 19th-highest total of any city in SmartAsset's study. Those markets give Madison residents a way to buy local produce and other products (like cheese!) directly from the people who grow (and produce) it.
Madison also rates as a great city for families in a number of other respects, including its low unemployment rate, which at 2.9 percent is 18th-lowest in SmartAsset's analysis.
Methodology and sources
To find the best green cities for families, SmartAsset considered metrics encapsulating both the environmental impact of living in a city and each city's overall level of family-friendliness. We considered 327 cities in our analysis, looking at 11 different metrics in total. The following six metrics reflect how environmentally-friendly each city is:
- EPA air quality index annual average.An index reflecting the amount of particulate matter, ozone and other pollutants in the air over the course of the year.
- Clean commuters. The percentage of workers who do not drive to work alone and instead either walk, bike, use transit or carpool.
- Local government renewable energy usage. The percentage of energy the local city or county government gets from renewable sources.
- Number of farmers markets.
- Housing density.
- Average household carbon footprint.
In addition to those six metrics, we considered five that gauge the overall quality of life for families in each city.
- Violent crime rate.
- Median household income.
- Median annual housing costs.
- Unemployment rate.This is the December 2015 county unemployment rate for the county in which each city is located.
- Average high school graduation rate of local schools.
We ranked each city in our analysis according to those 11 metrics. We then averaged those rankings, giving equal weight to each metric. Index scores and the final rankings were determined by those averages. The city with the best overall average is ranked first and scored a perfect 100, with cities with lower average rankings got lower scores.
Data on the median household income, median annual housing costs, housing density and the percentage of clean commuters comes from the U.S. Census Bureau. Data on the unemployment rate comes from the Bureau of Labor Statistics. Data on the violent crime rate comes from the FBI Uniform Crime Reporting system and local government websites. Data on average high school graduation rates comes from the U.S. Department of Education's EdFacts website.
Data on local government renewable energy usage was provided by the EPA's Green Power Partnership. Data on the number of farmers markets comes from the U.S. Department of Agriculture. Data on the average household carbon footprint comes from the UC Berkeley CoolClimate Network, Average Annual Household Carbon Footprint (2013), available at coolclimate.berkeley.ed.