On Wall Street, scary signs are popping up
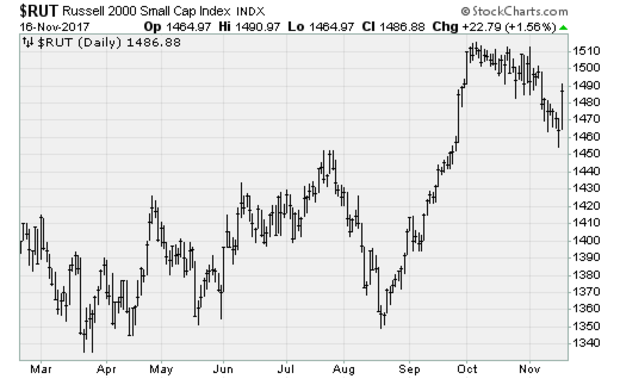
US equities rebounded strongly on Thursday as the House GOP passed its tax-reform proposal and investors embraced a classic buy-the-dip mentality after a couple of weeks of weakness in stock prices (especially in small-cap stocks, as the chart below shows).
Breadth was heavily positive in what looked and felt like panicked short-covering (when traders who were betting on falling stock prices had to reverse their positions and buy). Advancers outpaced decliners by a 3-to-1 ratio.
But investors should think twice before jumping in with aplomb.
Stepping back, it looks like the motivation for the rebound was a massive turnaround in junk bonds, weakness in US Treasury bonds (helping "risk-parity" funds) and a big capital injection by the People's Bank of China. Bitcoin also rebounded, up 40 percent from its weekend lows.
What lies ahead depends in some measure on the chances that tax reform can get through the Senate, where the GOP maintains only a two-vote buffer. But yesterday, Republican Senator Ron Johnson of Wisconsin said he would vote against the bill as it stands now because he believes it has a disproportionate focus on big businesses. A group of other GOP senators has expressed some reservations as well.
A vote on the floor of the Senate isn't expected until after Thanksgiving, leaving the market in a lull.
But below the surface, market internals are sending clear warning signals, mainly related to the consistent deterioration in breadth as fewer and fewer stocks participate to the upside while a handful of others keeps the major averages aloft as if nothing's wrong. For example, more than 8 percent of the stocks in the S&P 1500 index are overbought, yet another 8 percent are oversold. That's the most in both categories in more than 10 years.
Jason Geopfert at SentimenTrader noted that more than 30 percent of S&P 500 stocks are trading below their long-term averages -- something that has happened earlier only "immediately before major corrections" when combined with a multitude of technical warning signals like the "Hindenburg Omen" and "Titanic Syndrome." Both of those basically occur when a large number of stocks are both hitting new highs and plumbing new lows, evidence of dissonance within the market.
Clusters of these signals were seen near market peaks in 2000, 2007 and 2015, although in greater numbers than now.
The best way to summarize conditions on Wall Street: The relentless buying pressure shows no signs of stopping just yet. But based on what's happening among the most hated stocks, the end is nigh.