Watch out -- market weakness is spreading
The stock market has recently been suffering from a severe case of bipolar personality disorder. If you look at the large-cap indexes regular Americans follow in the nightly news, Wall Street has appeared to be cruising along, with both the Dow Jones industrial average and the S&P 500 hitting new record highs as recently as Friday.
Monday and Tuesday then put that record run hard into reverse. But especially for the rest of the market, even as the Dow and S&P 500 racked up record highs, it has been a different story. The NYSE Composite Index has been sliding sideways all year. On Friday, just 40 percent of the stocks on the NYSE moved higher.
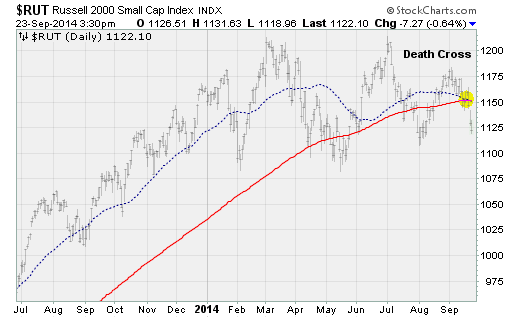
And small caps have been abysmal, with the Russell 2000 small-cap index suffering a "death cross" on Monday. Its 50-day moving average crossed below its 200-day moving average for the first time since 2011 after suffering its largest two-day drop in five months. (In another dark sign, the "Hindenburg Omen" was triggered on Thursday and Friday as well.)
Given very weak market internals, and the fact that stocks have had a rough time in September recently, further weakness looks likely. Here's why.
If you lift the façade of price stability and move beyond simplistic metrics like Dow 17,000 and S&P 500 2000, the situation looks more fragile.
Around 45 percent of the stocks in the NYSE are above their 50-day moving average, a measure of medium-term trend. That's down from 65 percent at the start of September and nearly 85 percent back in July. Just 71 percent of the stocks in the S&P 500 are in uptrends, down from 76 percent at the start of the month and a high of 85 percent back in July. And on Monday, the NYSE had more than 2,000 net declining issues -- the worst result since late July.
A number of catalysts are in play, including the start of airstrikes on ISIS in Syria, "no more cheap money" comments from officials at the Federal Reserve (and at the People's Bank of China, the Bank of Japan and the European Central Bank) as well as weak U.S. housing market data (as cash-only investors start back away).
But above it all is a nagging sense that with the Fed's QE3 bond-buying program about to end, with interest rate hikes approaching, with investors choking on money-losing IPOs at a pace not seen since the first dot-com bubble and with political pressure rising as Occupy protestors storm Wall Street and midterm elections approach, it's no wonder billionaires are raising the amount of safety cash in their portfolios.
Other smart-money players are moving to the sidelines. And options traders, as measured by the SKEW index, are betting heavily on a "black swan"-type market decline on a scale tied for the highest level since 1989 (October 1998 was the other instance, which came in the wake of the Russian bond default).
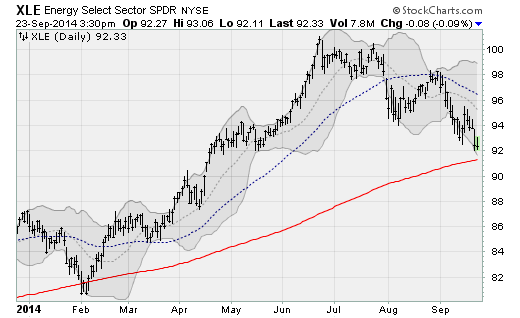
Given all this, I continue to recommend that my Edge Letter subscribers focus on profiting from areas of market weakness, such as the energy sector (as evidenced by the slide in the Energy Select Sector ETF (XLE) in the chart above). You can do so via leveraged inverse ETFs like the ProShares UltraShort Oil & Gas (DUG), which is up 7.2 percent since Sept. 9.