Stock market "pump-and-dumps" suggest trouble ahead
The recent ups and downs are enough to make even the most grizzled market veteran feel a little seasick.
Over the last two weeks, stocks have shown a tendency to rise early in the morning (helped by a ramp in futures trading just before the opening bell), chop around midday and slide lower into the close.
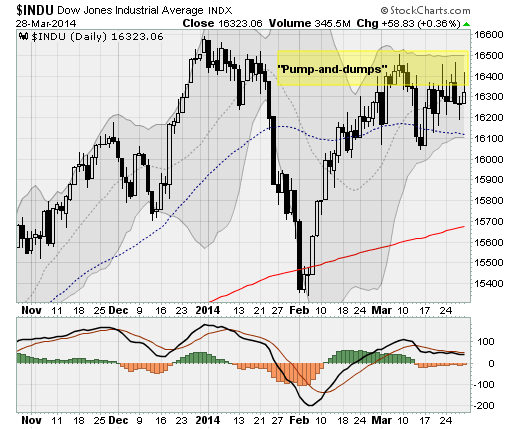
This behavior has been seen most clearly seen in the Dow Jones industrial average, whereas smaller indices such as the Russell 2000 and Nasdaq Composite have been markedly weaker. Hit by recent selloffs in tech momentum favorites like Twitter (TWTR) and Amazon (AMZN), as well as biotech stocks, these indices have scythed beneath their 50-day moving averages in the most significant pullbacks since the January dive on emerging market fears. That's worrisome because these are better, broader representations of the health of the overall stock market.
Digging deeper, there is growing evidence that the market's ups and downs are masking some serious selling pressure beneath the surface -- selling pressure that has already, by one measure, threatened to end the stock market rally that started in late 2012.
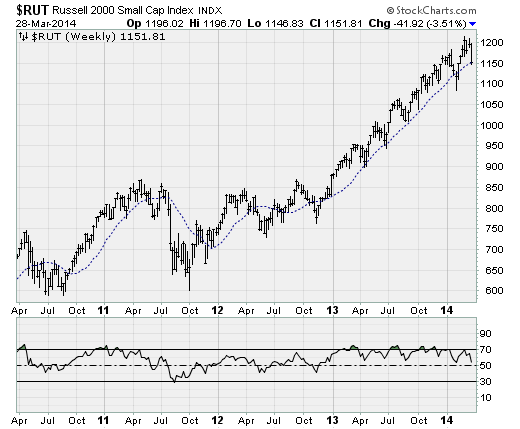
Both the Nasdaq and Russell 2000 have largely stayed above their respective 20-week moving averages over this time. Excursions below have been short-lived buying opportunities, such as the dips seen in January, last June, and last April. Such persistence actually exceeds what was seen during the dot-com bubble of the late 1990s (not in the magnitude of the rise, but in its unbroken nature).
But now, both averages are perched right on this level as they roll out of the most overbought technical condition -- as highlighted by the relative strength indicator shown in the chart above -- since 2011.
To be sure, these investment professionals were vulnerable, Jason Goepfert of SentimenTrader notes that active investment managers have continued to maintain extreme long exposure to stocks. This comes from data by the National Association of Active Investment Managers. The most recent results show that the average market exposure -- the spread between the most bullish and most bearish managers -- and confidence among all managers has reached levels only seen two other times in the eight-year history of the survey. These were in early January 2007 and in early January 2014.
Both times were followed by difficult periods in the market.
There is plenty of other evidence of excessive exuberance. Money-losing IPOs are being rushed to market. The bond market is awash in covenant-lite, or "cov-lite," loans that trade bondholder rights for the promise of higher yields. And any slowdown in the macroeconomic data, whether U.S. home sales, manufacturing activity in China or retail spending in Japan, is dismissed as non-threatening on the grounds that it only increases the odds of fresh monetary stimulus.
All of this has the air of market professionals trying to hold the market aloft -- by holding the Dow, which is watched by regular mom and pop investors, in stasis -- in order to exit positions ahead of what they fear will be a protected downturn.
Goepfert maintains what he has dubbed the "Smart Money Index," which subtracts the performance of large stocks during the first half-hour of trading and adds the last hour. The justification is that retail investors are more active in the morning, while the professionals are active near the closing bell. As you can imagine, the index has been moving lower quite violently over the last two weeks.
In fact, since at least 1998, a two-week decline of this magnitude has never been recorded. The only time that nears what we're seeing now was in late 2007 and early 2008 as the last bull market was in its death throes.
I'm not saying that a repeat is a sure thing, and neither is Goepfert. Yet, after considering all the evidence, the situation is certainly scary.
For now, I continue to recommend that investors stay defensive, book profits, raise cash allocations and consider safe-haven positions such as U.S. Treasury bonds, which this week broke up and out of a multi-month consolidation pattern.
For the more aggressive traders out there, the breakdown in big tech stocks is creating put option opportunities in names like Google (GOOG) and Facebook (FB). The FB April $65 puts that I recommended to clients last Friday are up more than 200 percent in just a week -- demonstrating just how violent some of the selloffs have become.
Disclosure: Anthony has recommended puts against GOOG, FB, and AMZN to his clients.
Anthony Mirhaydari is founder of the Edge and Edge Pro investment advisory newsletters, as well as Mirhaydari Capital Management, a registered investment advisory firm.