Half of America hasn't recovered from the recession
A decade after the financial crisis, the U.S. economy seems to be firing on all cylinders, with unemployment at a 50-year low and growth hitting its stride. But a deeper look reveals a more troubling picture: Between 2012 and 2015 -- a period when the recovery seemed to be gaining speed -- nearly half of all counties nationwide saw flat or declining growth, according to new government data.
More broadly, the Commerce Department figures highlight a stark and worrisome reality: While a handful of places around the U.S. are thriving, most regions are barely trudging ahead. And that trend is creating a widening geographic gap between a relatively few prosperous areas, mostly urban oases, and the desert of stagnation that lies beyond.
"For many communities, what you've got is a lost decade of economic growth," said John Lettieri, CEO of the Economic Innovation Group, a bipartisan think tank, adding that "the topline economy doesn't match the local experiences."
This is what inequality looks like
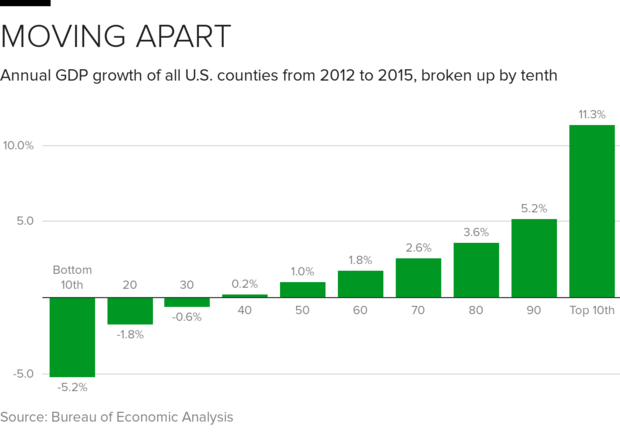
The bottom third of U.S. counties actually saw their economies shrink. Gross domestic product in these places, whose ranks include St. Clair County, Missouri, and Macon County, Illinois, shrank by an average of 2.25 percent each year between 2013 and 2015. (GDP represents the sum total of all the goods and services produced in a location in a given year.) For another 20 percent of counties, growth averaged an anemic 0.6 percent a year during that period.
By contrast, the few counties that did perform well economically saw spectacular growth. The top tenth expanded their economies by 11 percent every year between 2013 and 2015.
For comparison, the nation's overall GDP grew 1.8 percent in 2013, 2.5 percent the following year and 2.9 percent in 2015. Economists expect growth of around 3 percent this year.
It's worth noting that the Commerce data represent the first time the Bureau of Economic Analysis has issued county-level data. So they should be considered preliminary. And local economies, because they're often so small, can see large percentage shifts from one year to the next.
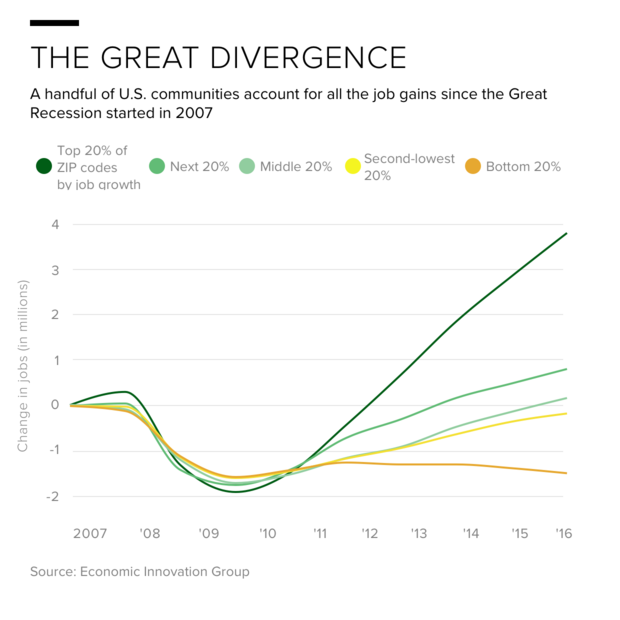
Still, EIG has found a similar divergence in taking a more granular approach to measuring economic growth. Perhaps the clearest sign of the imbalance between have and have-not counties: Between 2007 and 2016, the U.S. added 3.7 million net new jobs, Lettieri said. But more than 90 percent of those were created in the richest 20 percent of ZIP codes.
Looking at individual employers shows the same story. Between 2007 and 2016, the country added about 53,000 businesses, according to Census data. But just five counties together added even more -- about 55,000 businesses. The winners: the boroughs of Brooklyn and Queens in New York; Los Angeles; Florida's Miami-Dade; and Harris County, Texas (home to Houston).
While the majority of densely populated counties added businesses, most counties with a population of less than 500,000 lost businesses from 2007 to 2016. Among the smallest counties (fewer than 100,000 people) only 1 in 5 added businesses over that time period.
"At the root of this is a question of whether, from one generation to the next, people feel that the economy gives them a fair shot at the American Dream," Lettieri said. "If you're increasingly segregating the American population into places that are opportunity-rich and hard to get into… that divide between prosperous and distresses places, that threatens the idea of fundamental fairness to our system."