Bulls may be losing control of the stock market
Things are getting serious now.
At first, the recent bout of stock market weakness looked to be just another mild, short-lived pullback that ended as soon as the fear really started to build. We've seen a few of these episodes since the market's current easy, no-drama trajectory higher started in late 2012.
But the evidence is building that something is different this time. And although things look fine if you just look at a chart of the Dow Jones industrial average, other measures of the market suggest the sell-off has moved into more dangerous territory.
Here's why.
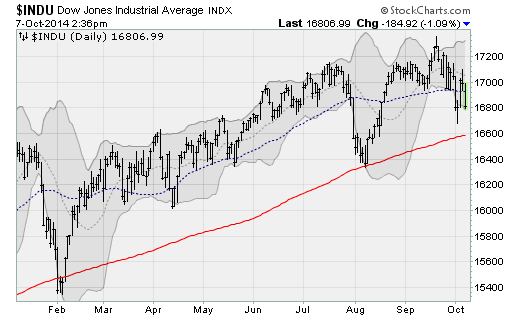
Compare what's happening with the Dow, which is trading near its 50-day moving average and remains well above its August lows, to what's happening with a broader measure of the stock market, the NYSE Composite Index. The latter fell below its 200-day moving average for the first time since 2012 last week, recovered above this level on Friday, but dropped back below it on Tuesday.
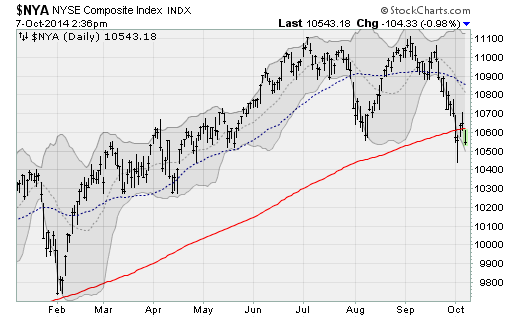
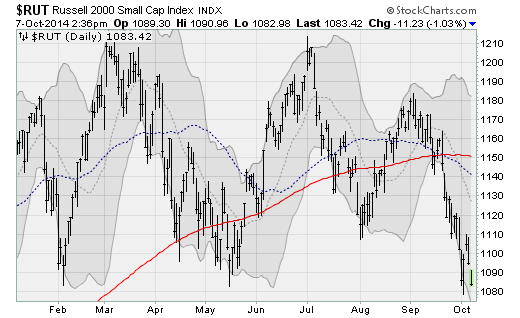
While the Dow is down less than 3 percent from its record highs, the NYSE Composite is already down 5 percent. Other measures are even worse: The Russell 2000 small-cap index is down nearly 11 percent from its high.
While this may not seem like that big of a deal -- merely a line in the sand -- this level has supported the NYSE Composite during the June 2013, February 2014, and August 2014 pullbacks. So, people have been paying attention to it as a level the bulls wouldn't tolerate moving below given the recovering economy and steady flow of cheap-money stimulus from the Federal Reserve.
But now, with the bears pushing forward like a football team whose offense is gaining ground on every play, the bulls' defenses are faltering.
It hasn't happened all at once. But it has featured a cascade of failures, with the bulk of risky assets -- not just stocks but bonds, commodities and foreign issues as well -- peaking ahead of the Independence Day holiday. You might remember that as the weekend, glowing with the summer sun, family, friends, backyard BBQs and fireworks, that featured the Dow's first-ever move above the 17,000 level.
Since then, a growing swath of the market has been moving to the downside. It started with small caps as the Russell 2000 hit resistance on July 3 from its March high (before the biotech/big-tech sell-off that ended in May) and set a series of lower highs and lower lows since then.
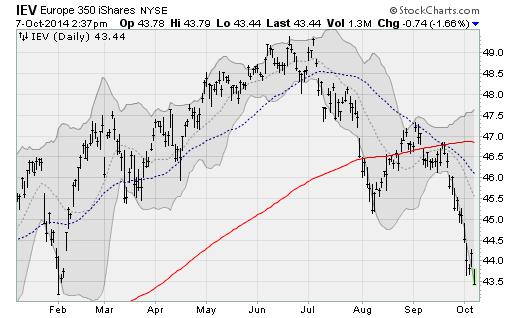
European stocks peaked at this time as well, with the Europe 350 iShares (IEV) "double-topping" in June and July before starting a long slide lower amid economic stalling and lost confidence in the European Central Bank's ability to fix the problem with more monetary stimulus. The IEV is down 8 percent already.
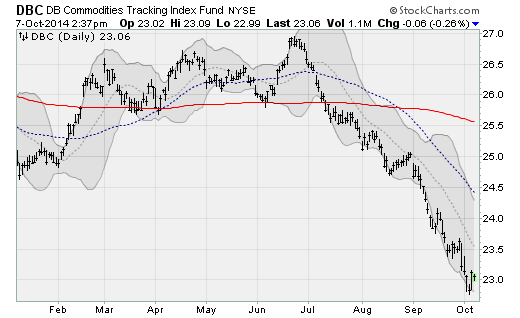
Commodities did the same, with the DB Commodities Tracking Fund (DBC) topping in late June and collapsing 14.4 percent since then.
Rolling forward, high-yield bonds hit a wall in August, double-topping off resistance from their early-July high, pushing the iShares High Yield Corporate Bond (HYG) lower.
Moving into early September, emerging-market stocks and U.S. mid-cap stocks peaked.
And now, finally, the selling pressure has hit the last bastions of strength: U.S. large-cap stocks like those in the Dow industrials as well as Japanese equities. In fact, Japan's Nikkei Index was the holdout, setting a high as recently as Sept. 25 before rolling lower.
Another way to look at this is through market "breadth." The number of stocks participating to the upside peaked in July and has been moving lower. Back then, nearly 85 percent of the stocks on the NYSE were above their 50-day moving averages. This dropped to 65 percent as the market rebounded from its August lows. Now, it stands at just 25 percent.
Unless the bulls step up and reverse the rising bear tide right here, right now, history suggests this won't end until the holdouts join the early losers to the downside. If the Russell 2000's drop is any guide, that would mean the Dow would need to drop to levels last seen in November near 15,600 -- another 7 percent plus decline from current levels.
So, investors don't have many safe havens out there because pretty much every single asset class -- even Treasury bonds -- has been hit with bouts of volatility lately. And I expect to see more of that as we head into the year-end and the market is forced to digest major catalysts, including the end of the Fed's QE3 bond-buying program and the looming midterm elections.
With the bulls looking like they could falter, conservative investors should consider increasing cash allocations here.