How does your state's economy compare with other states?
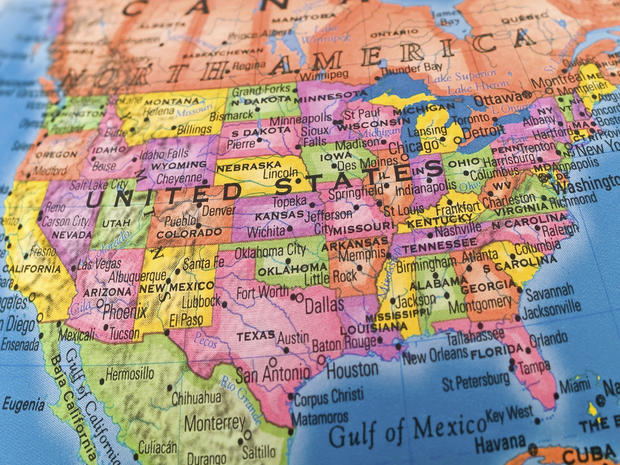
The U.S. economy is slowly recovering from the depths of the Great Recession, with the labor market in particular rebounding from the crisis. But that fitful recovery has been an uneven one. Some parts of the country have already shrugged off the impact of the epic housing bubble, while other regions continue to languish.
The result? Americans' experience of the recovery largely depends on where they live. Jobs may be plentiful in one state, for instance, but remain hard to come by in another, while the cost and value of a home -- ground zero for the crash -- also depend more on local conditions than national economic data can fully capture.
To get a closer view of how the recovery is faring, CBS MoneyWatch and research firm FindTheBest.com have drawn on a range of data (compiled in December and January) to put together key economic metrics for each of the 50 states. Unemployment, household income, rental and housing ownership data is from the latest American Community Survey.
Read on for a look at how your state's economy compares with others, and with the U.S. as a whole.
Alabama
Housing: The median sales price for a home in Alabama is $109,230, lower than the national median sales price of $183,465. Home sale prices in the state were flat last year, when prices rose nearly eight percent overall across the U.S.
Alabama's rate of property ownership, where the owner or a co-owner lives in the property, is higher than average, coming in at 69.7 percent compared to the overall U.S. rate of 64.9 percent. About half of the state's rental units, meanwhile, cost between $500 and $1,000 per month, a lower percentage rate than the national average.
Income: Just over 30 percent of Alabama's population lives in a low income household, defined as a household with an annual income of less than $25,000. That's a high percentage of low-income households compared with the rest of the U.S. Nearly 26 percent of the state's households are considered lower middle class, with an annual income between $25,000 and $50,000.
Jobs: The state's unemployment rate, meanwhile, is 1.1 percent higher than the national average.
Alaska

Housing: The median sales price for a home in Alaska was $261,479. That's higher than elsewhere in the U.S., where the median sale price for homes was $183,465.
In terms of property ownership, where the owner or a co-owner lives in the property, Alaska is in line with the national average, with 63.8 percent of properties owned and 36.2 percent renter-occupied. Just under 43 percent of rental units in the state cost between $500 and $1,000 per month, a lower percentage than elsewhere in the U.S.
Income: Just over one-third of Alaska residents live in an upper middle class household, defined as having an annual income of between $75,000 and $150,000, a rate that's above the national average. The second-most common income rate in Alaska is lower middle class, with about 19.4 percent of state residents living in a household bringing in an annual income of between $25,000 and $50,000.
Jobs: Alaska's unemployment rate is 1.2 percent below the national average.
Arizona
Housing: The median sales price for homes in Arizona remain close to the national average of $183,465, coming in at $180,000. The property ownership rate is also close to the national average, with 64.4 percent owned compared to the overall U.S. rate of 64.9 percent.
Arizona residents are more likely to own than to rent, at a rate of 64.4 percent versus 35.6 percent -- levels that are close to the national average for owned properties. Nearly two-thirds of rental units in the state cost between $500 and $1,000 per month, well above the national average of 51.9 percent.
Income: Just over 26 percent of Arizona's population lives in a lower middle class household, defined as a household with an annual income of between $25,000 and $50,000, compared to the national average of 23.9 percent.
Jobs: The state's unemployment rate is 0.8 percent higher than the national average.
Arkansas

Housing: Median sale prices for homes in Arkansas are lower than elsewhere in the U.S., coming in at $119,000 compared to the national median sale price of $183,465.
The state's property ownership rate, where the owner or a co-owner lives in the property, is 66.7 percent, above the national average of 64.9 percent. In terms of rental units, 53.5 percent of those units cost under $500 per month in Arkansas. In contrast, fewer than 22 percent of rental units elsewhere in the U.S. cost under $500 per month.
Income: Just over 31 percent of Arkansas's population lives in a low-income household, or a household with an annual income of less than $25,000, compared to the national average of 23.4 percent. The second-most common household income level is lower middle class. Nearly 28 percent of Arkansas residents live in a household earning between $25,000 and $50,000 annual.
Jobs: The state's jobless rate is 0.8 percent below the national average.
California
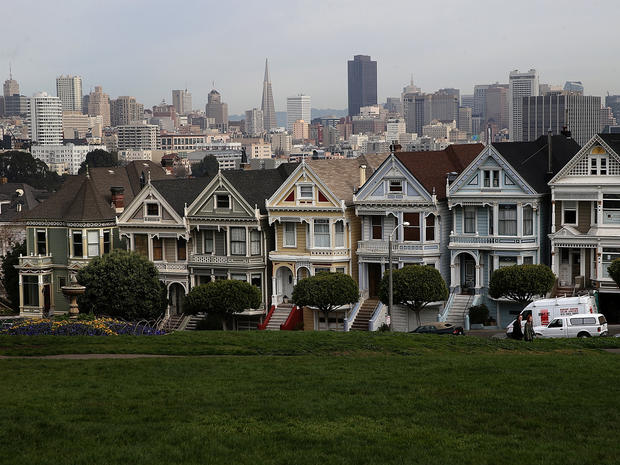
Housing: The median sales price for homes in California is $370,000, well above the national median price of $183,465. The state's rate of property ownership, where the owner or a co-owner lives in the property, is below the national average, at 55.3 percent in California versus 64.9 percent elsewhere in the U.S.
Over one-third of rental units in California, at 36.7 percent, cost between $500 and $1,000 every month, compared with 51.9 percent for the U.S. as a whole.
Income: About 27.3 percent of the state's population lives in households considered upper middle class, with an annual income between $75,000 and $150,000, compared to 25.1 percent elsewhere nationally. The second-most common income level per household was lower middle class, with 21.4 percent of California households bringing in an annual income of between $25,000 and $50,000.
Jobs: Unemployment in California is 1.8 percent higher than the national jobless rate.
Colorado

Housing: Median sale prices for homes in Colorado are above the national median of $183,465, coming in at $260,000. Property ownership in the state, where the owner or a co-owner lives in the property, is on par with the national average of 64.9 percent, at 65.4 percent.
Roughly 56 percent of rental units in Colorado cost between $500 and $1,000 per month, compared to 51.9 percent elsewhere in the U.S.
Income: About 28 percent of Colorado's population lives in a household considered upper middle class, defined as having an annual household income of between $75,000 and $150,000, compared to the national average of 25.1 percent. The next most common household income level in the state is lower middle class, with 23 percent of Colorado residents living in households with an annual income of between $25,000 and $50,000.
Jobs: Colorado's unemployment rate is 1.2 percent lower than the national average.
Connecticut

Housing: Home prices in Connecticut have been sliding, with the median sale price in the state falling 4.5 percent in 2014 compared to a year earlier. The median sale price for homes in Connecticut is $200,500, or on par with the U.S. median sale price of $183,465.
The state's property ownership rate, meanwhile, is 67.8 percent, compared with the overall average of 64.9 percent. About 53 percent of rental units in the state cost between $500 and $1,000 per month, close to the U.S. average of 51.9 percent.
Income: Nearly 30 percent of Connecticut residents live in a household considered upper middle class, defined as a household earning between $75,000 and $150,000 annually, compared to the national average of 25.1 percent.
Jobs: Connecticut's unemployment rate is in line with the national jobless rate.
Delaware
Housing: Median sales prices for homes in Delaware are rising, increasing this year by nearly four percent compared to a year ago, although that's below the national average of 7.9 percent growth. The median sale price for homes in the state is $227,500, compared to the national median price of $183,465.
Property in Delaware is more likely to be owned than rented. The state's most recent property ownership rate, where the owner or a co-owner lives in the property, was 72.5 percent, versus the national average of 64.9 percent. Over 58 percent of rental units in Delaware cost the renter between $500 and $1,000 per month, compared to 51.9 percent elsewhere in the country.
Income: early 29 percent of the state's population lives in an upper middle class household, defined as a household with an annual income between $75,000 and $150,000, compared to the national average of 25.1 percent.
Jobs: Unemployment in Delaware is 0.8 percent below the national average.
Florida

Housing: Sale prices for homes in Florida are rising faster than the national rate, up 9.6 percent from last year compared to 7.9 percent growth elsewhere in the U.S. The median sales price for homes in the state is $163,500, below the national median sale price of $183,465.
Property ownership in the state, where the owner or a co-owner lives in the property, stands at 67.1 percent, or above the national average of 64.9 percent.
Income: About 27 percent of Florida residents live in a household considered lower middle class, defined as a household with an annual income of between $25,000 and $50,000, compared to the national average of 23.9 percent. The second-most common household income level in the state is defined as low income, with around 25.7 percent of Florida's residents living in a household earning an annual income of under $25,000.
Jobs: Florida's unemployment rate is high at 2.1 percent above the national average.
Georgia

Housing: Real estate prices in Georgia are growing faster than the national average, up 13 percent from a year earlier, compared to 7.9 percent for the U.S. as a whole. The median sale price for a home in Georgia is $147,950, or below the national median sale price of $183,465.
Some 65 percent of property in the state is owned, defined as the owner or a co-owner living in the property, a figure on par with the national average of 64.9 percent. In terms of rentals, 61.1 percent of rental units in Georgia cost between $500 and $1,000, higher than the national average of 51.9 percent.
Income: Close to 26 percent of Georgia residents live in a household defined as low income, or a household earning less than $25,000 annually. That's a higher percentage than the 23.4 percent national average.
Jobs: Georgia's unemployment rate is 1.6 percent above the national average.
Hawaii

Housing: Real estate prices in Hawaii have been rising more quickly than in other parts of the U.S., up 8.4 percent from a year ago, compared with 7.9 percent nationwide. The median sale price for a home in the state is $450,000, well above the national sale price of $183,465.
Property ownership rates in Hawaii, defined as where the owner or a co-owner lives in the property, are lower than that national average of 64.9 percent, coming in at 57.6 percent. About 42.3 percent of rental units in Hawaii cost $1,500 or more per month to rent, well over the national average for that rental level of 11.1 percent.
Income: Nearly one-third of Hawaii's population lives in a household classified as upper middle class, or having an annual income between $75,000 and $150,000, compared with the national average of 25.1 percent.
Jobs: Unemployment is low in Hawaii at 2.9 percent below the national average.
Idaho

Housing: Real estate prices in Idaho are rising, but at a slower rate than the U.S. as a whole. They rose 2.9 percent in the state in 2014, compared to 7.9 percent nationally. The median sale price for a home in Idaho is $176,010, close to the national median price of $183,465.
Nearly 70 percent of property in Idaho is owned, rather than rented, above the national average of 64.9 percent. Just over 54 percent of rental units in the state cost between $500 and $1,000 to rent, compared to 51.9 percent nationally.
Income: About 28.6 percent of Idaho residents live in a household defined as lower middle class, or with an annual household income of between $25,000 and $50,000, higher than the 23.9 percent national average.
Jobs: Idaho's unemployment rate is 0.8 percent lower than the national average.
Illinois

Housing: Real estate prices in Illinois are rising, increasing 3.6 percent last year compared with 2013. But that growth is less than the 7.9 percent national rate. The median sales price for homes in Illinois is $145,050, compared to the national median of $183,465.
Property in the state, defined as where the owner or a co-owner lives in the property, is owned at a rate of 67.5 percent, or above the 64.9 percent of units owned rather than rented nationally.
Income: About 55 percent of rental units in Illinois cost the renter between $500 and $1,000 per month, above the national average of nearly 52 percent.
Jobs: Illinois's jobless rate is 0.8 percent higher than the national average.
Indiana
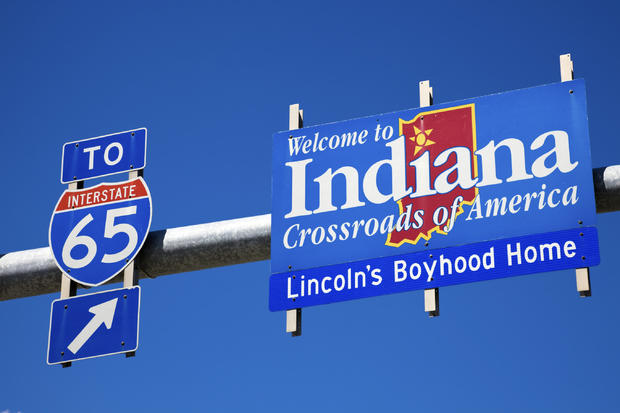
Housing: Real estate prices in Indiana rose over seven percent in 2014, compared to a year earlier, or on par with that national growth rate of 7.9 percent for that time period. The median sale price for a home in the state is $136,563, compared to the national median of $183,465.
Sale prices in Indiana increased 7 percent in 2014, versus 7.9 percent nationwide. Indiana residents are much more likely to own or co-own the property they live in, rather than rent at a rate of 70 percent, compared to the national average of 64.9 percent. Roughly 58 percent of rental units in Indiana cost between $500 and $1,000 per month to rent, or higher than the 51.9 percent national average.
Income: About 27.1 percent of Indiana residents live in a lower middle class household, or defined as a household with an annual income of between $25,000 and $50,000. This is a high percentage of lower middle class households compared with the national average of 23.9 percent.
Jobs: Indiana's jobless rate is the same as the national unemployment rate.
Iowa

Housing: Real estate sale prices are rising in Iowa. They increased by 2.73 percent in 2014 compared to a year earlier, although that growth rate remains below the national level of 7.92 percent.
The median sale price for homes in Iowa is $113,000, compared to the national price of $183,465. Over 72 percent of property in Iowa is owned, meaning the owner or co-owner lives there, rather than rented, a much higher percentage than the national rate of 64.9 percent. In terms of rental units, 46.2 percent of renters in Iowa pay between $500 and $1,000 per month. The national average for renters at that rate is nearly 52 percent.
Income: Nearly 26 percent of Iowa residents live in a lower middle class household, defined as a household with an annual income of between $25,000 and $50,000, compared to the 23.9 percent national average. The next most common household income level in the state was upper middle class (earning a household annual income between $75,000 and $150,000), at 25.6 percent, or close to the national average of 25.1 percent.
Jobs: Iowa's unemployment rate is low, at 3.8 percent below the national average.
Kansas
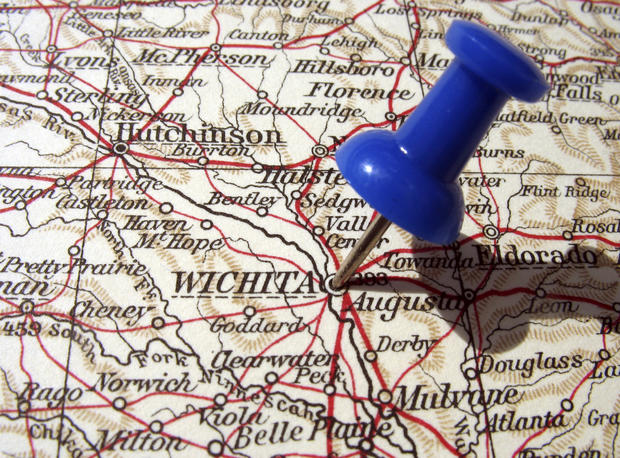
Housing: Real estate prices in Kansas are about the same as they were a year ago. The most recent median sale price for homes in the state was $162,237, compared to a national median sale price of $183,465.
Property in Kansas is much more likely to be owned, meaning the owner or co-owner lives there, than it is to be rented. That 67.5 percent rate of property ownership is above the national average of 64.9 percent. Some 47 percent of rental units in Kansas cost between $500 and $1,000 per month to be rented, below the national average of nearly 52 percent.
Income: More than 26 percent of Kansas residents live in a lower middle class household, defined as a household with an annual income of between $25,000 and $50,000, compared to 23.9 percent elsewhere in the U.S.
Jobs: The jobless rate in Kansas is currently 2.7 percent lower than the national average.
Kentucky

Housing: Real estate prices in Kentucky rose 12.2 percent last year compared with 2013, well above the 7.2 percent growth seen on average across the U.S. The median sale price for a home in Kentucky is $120,000, compared to the national median of $183,465.
Roughly 68 percent of property in Kentucky is owned, meaning the owner or co-owner lives there. In comparison, 64.9 percent of all U.S. property is owned. Nearly half of all rental units in the state cost the renter under $500 per month, compared to 21.6 percent nationwide.
Income: Just over 30 percent of Kentucky's population lives in a low-income household, defined as a household where the annual income is less than $25,000. In comparison, 23.4 percent of the overall nation is classified as low income households.
Jobs: Kentucky's unemployment rate is in line with the national jobless rate.
Louisiana

Housing: Sale prices for Louisiana real estate were up 7.25 percent compared to a year earlier, in line with the overall U.S. growth of 7.9 percent during the same time period. The most recent median sale price for homes in Louisiana was $148,000, or lower that the rest of the U.S, where the median sale price was $183,465.
About 67 percent of property is Louisiana is owned, meaning the owner or co-owner lives in the home, a higher rate than the national average of 64.9 percent. Nearly 60 percent of rental units in Louisiana cost between $500 and $1,000 to rent per month, compared to the national average of 51.9 percent.
Income: Close to 30 percent of Louisiana residents live in a low-income household, defined as a household with an annual income of less than $25,000, compared to the national average of 23.4 percent. The second-most common income level in the state is lower middle class, with 24.6 percent of Louisiana's population living in a household with an annual income of between $25,000 and $50,000.
Jobs: Louisiana's unemployment rate is 0.9 percent below the national average.
Maine

Housing: Real estate prices in Maine rose by 6.91 percent compared to a year earlier, versus the 7.92 percent seen across the U.S. The current median sale price for a home in Maine was $185,984, or close to the national median sale price of $183,465.
Nearly 72 percent of property in Maine is owned, meaning the owner or co-owner lives in the home, compared to the national average 64.9 percent. The majority of rental units in Maine, 60.9 percent cost between $500 and $1,000 every month. The national average for rental units in that price range is 51.9 percent.
Income: About 26.2 percent of Maine's population lives in a lower middle class household, defined as a household with an annual income of between $25,000 and $50,000. This is a higher percentage than the national average, which stands at 23.9 percent. The second most common household income level in the state is low income, with 25.2 percent of Maine residents living in a household earning an annual income lower than $25,000.
Jobs: Maine's unemployment rate is 1.9 percent lower than the national average.
Maryland
Housing: Real estate prices in Maryland remain close to their level of a year earlier,The most recent median sale price for a home in Maryland was $250,500. In contrast, the national meidal sale price was $183,465.
Property ownership in Maryland, meaning the owner or co-owner lives there, stands at 67.6 percent, compared to the national average of 64.9 percent. Just over 41 percent of rental units in the state cost between $500 and $1,000 every month. The proportion of Maryland residents paying rent within this range is a lower than the U.S. national average of 51.9 percent.
Income: About 32 percent of Maryland residents live in an upper middle class household, defined as a household with an annual income between $75,000 and $150,000. This is a high percentage of upper middle class households for the U.S., where the national average for that income level is 25.1 percent.
Jobs: Maryland's unemployment rate is 1.5 percent lower than the national average.
Massachusetts

Housing: While home sale prices in Massachusetts are on the rise, they are growing more slowly than in the U.S. as a whole. The median sale price in the state rose by 6.4 percent in 2014 from the previous year, compared to the national average of 7.9 percent growth. The median price for homes in Massachusetts was $315,000, higher than the national median of $183,465.
Roughly 63 percent of property in Massachusetts is owned, meaning the owner or co-owner lives there, a lower proportion when compared to the national average of 64.9 percent. In terms of rental units, 39 percent of those units cost between $500 and $1,000 per month in the state. That's a much lower percentage when compared to the national average of 51.9 percent of rental units in that price range.
Income: Approximately 29 percent of Massachusetts's population lives in an upper middle class household, defined as a household with an annual income between $75,000 and $150,000. The national average for upper middle class households, in comparison, is 25.1 percent.
Jobs: The unemployment rate in Massachusetts is 0.7 percent lower than the national average.
Michigan
Housing: Sale prices in Michigan rose five percent in 2014 compared to a year earlier, below the national average of 7.9 percent for the same time period. The median sales price for homes in the state was $84,000, compared to the national median sale price of $183,465.
Property ownership in the state, defined as the owner or co-owner living in residence, stands at 72.1 percent, higher than the national average of 64.9 percent. Nearly 62 percent of rental units in Michigan cost between $500 and $1,000 every month to rent, higher than the national average of 51.9 percent.
Income: About 25.7 percent of Michigan residents live in a lower middle class household, defined as a household with an annual income of between $25,000 and $50,000. In comparison, the national average for lower middle class households in the U.S. is 23.9 percent. Approximately 25.6 percent of the state's residents living in a household earning an annual income lower than $25,000.
Jobs: Michigan's unemployment rate remains high, at 3.1 percent above the national average.
Minnesota

Housing: Home sale prices are rising in Minnesota, increasing by 6.7 percent in 2014, compared to 7.9 percent nationally. The most recent median sale price for homes in Minnesota was $171,750, compared to the national median sale price of $183,465.
Property ownership in Minnesota, meaning the owner or co-owner lives there, stands at 72.5 percent, or higher than the national average of 64.9 percent. The majority of rental units in the state, 55.5 percent, rent monthly at a cost of between $500 and $1,000. In contrast, 51.9 percent of rental units in the U.S. rent within that price range.
Income: Nearly 30 percent of Minnesota residents live in an upper middle class household, defined as a household with an annual income between $75,000 and $150,000, compared to the national average of just over 25 percent. The second-most common household income level in the state is lower middle class, with 22.5 percent of Minnesota's population living in a household earning an annual income between $25,000 and $50,000.
Jobs: Minnesota's unemployment rate is 2.5 percent lower than the national average.
Mississippi
Housing: Home sale prices in Mississippi jumped by 30.67 percent compared to a year earlier - a much greater increase in growth than the national average of 7.92 percent. The current median sale price for a home in Mississippi was $180,000; in line with the national median sale price of $183,465.
The property ownership rate in Mississippi, meaning the owner or co-owner lives there, is 69.4 percent, compared to the national average of 64.9 percent. About 48 percent of rental units in the state cost between $500 and $1,000 per month for rental, compared to the national average of 51.9 percent.
Income: More than one-third of Mississippi's population lives in a low income household, defined as a household with an annual income of less than $25,000. In comparison, the national average for low income households stands at 23.4 percent. The second most common household income level in Mississippi is lower middle class, with 26.4 percent of Mississippi's residents living in a household earning an annual income between $25,000 and $50,000.
Jobs: Mississippi's unemployment rate is 1.4 percent higher than the national average.
Missouri

Housing: Home sale prices in Missouri rose close to two percent in 2014 from a year ago, well below the 7.9 percent growth seen elsewhere across the U.S. The median sale price for a home in Missouri was $141,000, lower than the national median sale price of $183,465.
Property ownership in Missouri, meaning the owner or co-owner lives there, stands at 68.4 percent, compared with the national average of 64.9 percent. Most rental units in Missouri, at 53.2 percent, cost between $500 and $1,000 every month to rent, close to the national average of 51.9 percent.
Income: Approximately 26.5 percent of Missouri residents live in a lower middle class household, defined as a household with an annual income of between $25,000 and $50,000. The national rate for lower middle class households is 23.9 percent. The next most common household income level in the state is low income, with about 25.8 percent of Missouri's population living in a household earning an annual income lower than $25,000.
Jobs: Missouri's unemployment rate is 0.9 percent lower than the national average.
Montana

Housing: Although sale prices in Montana are on the rise, they are growing more slowly when compared to the national growth rate. The median sale price in Montana increased 1.7 percent in 2014, versus 7.9 percent nationwide.
The median sale price for homes in Montana was $213,638, higher than the national median sale price of $183,465. Property ownership in Montana, meaning the owner or co-owner lives there, stands at 68.3 percent, higher than the national average of 64.9 percent of properties owned. In terms of rental properties, 48.2 percent of rental units in Montana cost between $500 and $1,000 per month to rent, a lower proportion than the national average of 51.9 percent of rental units in that price range.
Income: Approximately 27 percent of Montana residents live in a lower middle class household, defined as a household with an annual income of between $25,000 and $50,000. In comparison, the national average for that income level is nearly 24 percent. The next most common household income level in the state is low income -- around 26.5 percent of Montana's residents living in a household earning less than than $25,000 a year.
Jobs: Montana's unemployment rate is 2.3 percent below the national average.
Nebraska
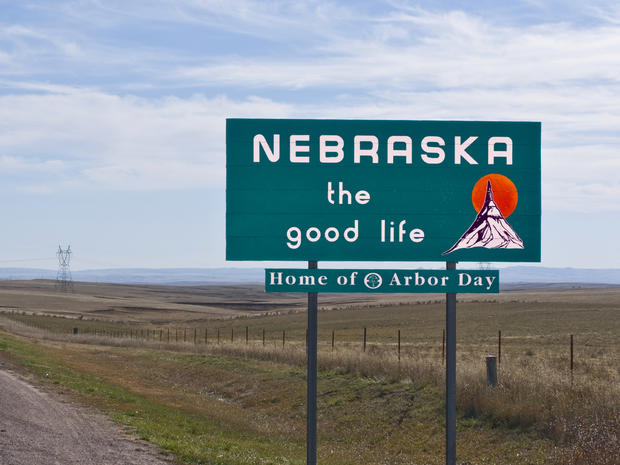
Housing: Real estate prices in Nebraska rose 1.7 percent in 2014, much slower than the 7.9 percent growth seen nationally. The median sale price for homes in Nebraska was $120,000, lower than the national median sale price of $183,465.
Property ownership in Nebraska, meaning the owner or co-owner lives there, stands at 67 percent, higher than the national average of 64.9 percent. Just over half of the rental units in the state cost between $500 and $1,000 per month, a figure close to the national average of 51.9 percent.
Income: About 26 percent of Nebraska's population lives in a lower middle class household, defined as a household with an annual income of between $25,000 and $50,000. That figure is higher than the national average of 23.9 percent. The second-most common household income level in the state is upper middle class -- with 25.1 percent of Nebraska residents living in a household earning an annual income between $75,000 and $150,000.
Jobs: Nebraska's unemployment rate is low, at 3.9 percent below the national average.
Nevada

Housing: Home prices in Nevada are on the rise and increasing more quickly than the national average. The median sale price in the state rose roughly 12 percent in 2014, compared with 7.9 percent nationally. The median sale price for a home in Nevada was $195,000, compared to the national median sale price of $183,465.
Property ownership in Nevada, at 56.7 percent, is below the national average of 64.9 percent. Over 61 percent of rental units in the state rent at between $500 and $1,000 per month, compared with 51.9 percent nationwide.
Income: Nearly 26 percent of Nevada's population lives in a lower middle class household, defined as a household with an annual income of between $25,000 and $50,000. That's higher than the national average of lower middle class households, which stands at 23.9 percent. The next most common household income level in the state is upper middle class, with 25.5 percent of Nevada's residents living in a household earning between $75,000 and $150,000 a year.
Jobs: Nevada's unemployment rate is 2.8 percent above the national average.
New Hampshire
Housing: The median sale price for homes in New Hampshire increased 5.5 percent in 2014, less than the 7.9 percent growth seen across the U.S. The most recent median sale price for a home in New Hampshire was $189,967, close to the national median sale price of $183,465.
About 71 percent of property in New Hampshire is owned, compared to 64.9 percent nationwide. Most of the rental units in the state, at 53.8 percent, cost between $500 and $1,000 per month to rent. That's slightly higher than the 51.9 percent national average for rental units in that price range.
Income: 31.2 percent of New Hampshire residents live in an upper middle class household, defined as a household with an annual income between $75,000 and $150,000. That's well above the 25.1 percent national average for upper middle class households. The second most common household income level in the state is lower middle class, with around 21.6 percent of New Hampshire's residents living in a household earning an annual income between $25,000 and $50,000.
Jobs: New Hampshire's unemployment rate is 2.7 percent lower than the national average.
New Jersey
Housing: The median home sale price in New Jersey increased 4.7 percent last year, compared with 7.9 percent for the U.S. as a whole. The median sale price for homes in New Jersey was $280,000, considerably higher than the national median sale price of $183,465.
The property ownership rate in the state is 65.6 percent, on par with the national average of 64.9 percent. About 42 percent of rental units in New Jersey cost between $500 and $1,000 per month to rent, compared with nearly 52 percent for the national average of rental units in that price range.
Income: Just over 30 percent of New Jersey's population lives in an upper middle class household, defined as a household with an annual income between $75,000 and $150,000. That's higher than the national average of 25.1 percent of households in that income bracket. The second most common household income level in the state is lower middle class, with approximately 18.6 percent of New Jersey's residents living in a household earning an annual income between $25,000 and $50,000.
Jobs: New Jersey's unemployment rate is about 0.5 percent above the national jobless rate.
New Mexico
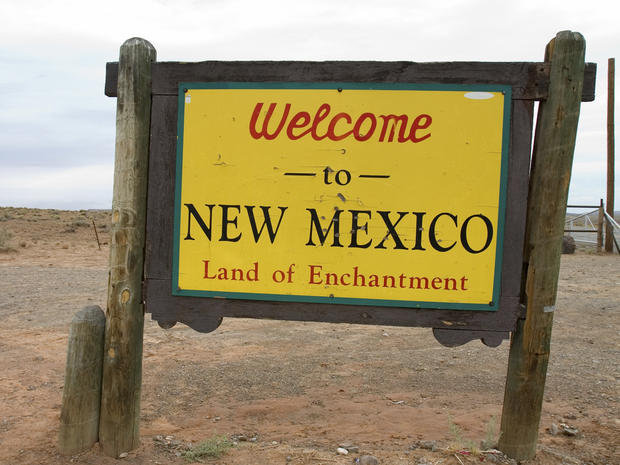
Housing: Home sale prices in New Mexico grew slightly last year, rising 1.5 percent -- that was well below the national growth rate of 7.9 percent. The most recent median sale price for homes in New Mexico was $179,248, close to the national median sale price of $183,465.
Roughly 69 percent of property in New Mexico is owned, versus 64.9 percent nationally. The majority of rental units in the state, 52.4 percent, cost between $500 and $1,000 every month to rent, close to the 51.9 percent national average for rentals in that price range.
Income: Approximately 29 percent of New Mexico's population lives in a low-income household, defined as a household with an annual income of less than $25,000. In comparison, the national average for low income households is 23.4 percent. The second most common household income level in the state is lower middle class, with around 25.8 percent of New Mexico residents living in a household earning an annual income between $25,000 and $50,000.
Jobs: New Mexico's unemployment rate is in line with the national jobless rate.
New York

Housing: The median sale price in New York increased by 25 percent from a year ago, well surpassing the 7.92 percent growth rate seen across The United States. The current median sale price for a home in New York was $300,000, higher than the median national sale price of $183,465.
Just over 54 percent of property in New York is owned, a lower figure than the 64.9 percent national average for owned properties. Some 36 percent of rental units in the state cost between $500 and $1,000 every month to rent. In comparison, 51.9 percent of rental units nationally fall within that price range.
Income: Approximately 26 percent of New York residents live in an upper middle class household, defined as a household with an annual income between $75,000 and $150,000. That figure is on par with the national average for upper middle class households of 25.1 percent. The next most common household income level in the state is low income -- around 23 percent of New York's population living in a household earning an annual income lower than $25,000.
Jobs: New York has nearly the same unemployment rate as the national average.
North Carolina

Housing: Sale prices in North Carolina have remained about the same from a year ago. The most recent median sale price for a home in North Carolina was $151,000, or lower than the median national sale price of $183,465.
Just over two-thirds of property in North Carolina is owned, meaning the owner or co-owner lives there, a rate slightly higher than the 64.9 percent national average. Nearly 53 percent of rental units in the state cost between $500 and $1,000 per month to rent, compared with 51.9 percent nationwide.
Income: Approximately 27 percent of North Carolina's population lives in a low-income household, defined as a household with an annual income of less than $25,000. In comparison, the national average for low-income households is 23.4 percent. Another 26.7 percent of North Carolina residents are classified as lower middle class, or living in a household earning an annual income between $25,000 and $50,000.
Jobs: North Carolina's unemployment rate is 1.3 percent higher than the national average.
North Dakota

Housing: The median home sale price in North Dakota rose 2.2 percent last year, far short of the 7.9 percent growth seen nationally. The median sale price for a home in the state was $189,881, close to the median national sale price of $183,465.
About 66 percent of property in the state is owned, a figure on par with the national property ownership average of 64.9 percent. In terms of rental units, 44.5 percent of those units in North Dakota cost between $500 and $1,000, a percentage considerably lower than the national average of 51.9 percent.
Income: Just over 27 percent of North Dakota's population lives in an upper middle class household, defined as a household with an annual income between $75,000 and $150,000, higher than the 25.1 percent of people nationally who live in upper middle class households. The second most common household income level in the state is lower middle class -- with nearly 25 percent North Dakota residents living in a household earning an annual income between $25,000 and $50,000.
Jobs: North Dakota's unemployment rate is low, at 6.4 percent below the national average.
Ohio
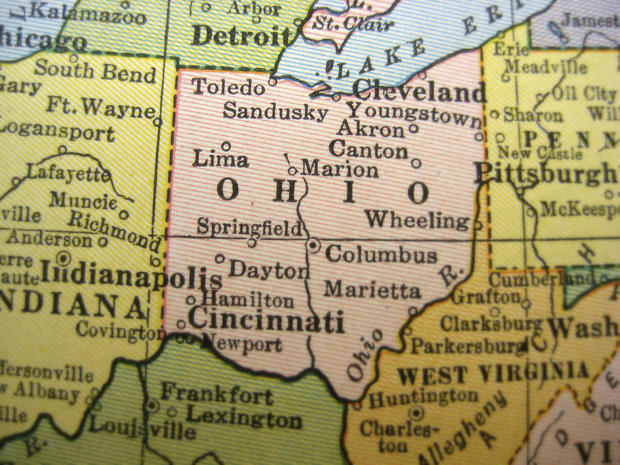
Housing: Home prices in Ohio shot up last ear, rising roughly 13 percent, versus 7.9 percent nationwide. The most recent median sale price for homes in Ohio was $107,500, compared to the median national sale price of $183,465.
Some 67 percent of properties in Ohio are owned, meaning the owner or co-owner lives there, compared to the national average of 64.9 percent. More than 54 percent of rental units in the state cost between $500 and $1,000 every month to rent, compared to the national average of 51.9 percent of people paying rent in this price range.
Income: Approximately 26 percent of Ohio's population lives in a low-income household, versus 23.4 percent for the nation as a whole. Another 25.7 percent of the state's residents are classified as lower middle class, or living in a household earning an annual income between $25,000 and $50,000.
Jobs: Ohio has nearly the same unemployment rate as the national average.
Oklahoma

Housing: The median home sale price in Oklahoma soared 12.4 percent in 2014, compared to 7.9 percent across the U.S. The median sale price for a home in Oklahoma was $113,000, or lower than the median national sale price of $183,465.
Oklahoma's proportion of owned units, at 67.1 percent, tops the national average of 64.9 percent. About 46.5 percent of rental units in the state cost under $500 per month, a rate much lower than the national average of 21.6 percent of people paying rent in that price range.
Income: About 27.2 percent of Oklahoma's population lives in a lower middle class household, defined as a household with an annual income of between $25,000 and $50,000. In comparison, 23.9 percent of U.S. residents are classified as living in lower middle class households. The second-most common household income level in the state is low income, with 27 percent of Oklahoma residents living in a household earning an annual income lower than $25,000.
Jobs: Oklahoma's unemployment rate is 2.6 percent lower than the national average.
Oregon

Housing: Although sale prices in Oregon are on the rise, they are growing more slowly than the national average. The median sale price in the state rose 6.4 percent last year, compared to 7.9 percent nationally. The median sale price for a home in Oregon was $228,875, considerably higher than the median national sale price of $183,465.
Income: Property ownership in Oregon stands at 62 percent, or below the national average of 64.9 percent. About 60 percent of rental units in the state cost between $500 and $1,000 per month to rent, a higher percentage than the national average of 51.9 percent.
About 25.5 percent of Oregon's population lives in a lower middle class household, defined as a household with an annual income of between $25,000 and $50,000 -- a higher percentage of than the 23.9 percent rate of lower middle class households nationally. The next most common household income level in the state is upper middle class, with 24.4 percent of Oregon's residents living in a household earning an annual income between $75,000 and $150,000.
Home: Oregon's unemployment rate is 1.7 percent higher than the national average.
Pennsylvania

Housing: While sale prices in Pennsylvania are on the rise, increasing by 5.19 percent from a year ago, they are below the 7.92 percent growth seen nationally. The most recent median sale price for homes in Pennsylvania was $142,000, or lower than the median national sale price of $183,465.
The rate of property ownership in Pennsylvania stands at 69.8 percent, above the national average of 64.9 percent. Nearly 56 percent of rental units in the state cost between $500 and $1,000 every month to rent, a rate higher than the national average of 51.9 percent in that price bracket.
Income: Approximately 25 percent of Pennsylvania's population lives in an upper middle class household, defined as a household with an annual income between $75,000 and $150,000. That percentage is the same as the national average of upper middle class households. The second-most common household income level in the state is lower middle class, with around 24.2 percent of Pennsylvania residents living in a household earning an annual income between $25,000 and $50,000.
Jobs: Pennsylvania's unemployment rate is 0.7 percent lower than the national average.
Rhode Island
Housing: While sale prices in Rhode Island rising, up 1.12 percent from a year earlier, they are growing more slowly the U.S. growth rate of 7.92 percent. The most recent median sale price for homes in Rhode Island was $180,000, on par with the national median sale price of $183,465.
Property ownership in Rhode Island is roughly 61.2 percent, below the national average of 64.9 percent. Nearly two-thirds of rental units in the state cost between $500 and $1,000 every month to rent, well above the 51.9 percent of rental units in that price range, nationally.
Income: Approximately 27 percent of Rhode Island residents live in an upper middle class household, defined as a household with an annual income between $75,000 and $150,000. That figure is above the 25.1 percent of upper middle class households for all the U.S. The second-most common household income level in the state is low income, with about 23.4 percent of Rhode Island's residents living in a household earning an annual income lower than $25,000
Jobs: In terms of unemployment, Rhode Island has nearly the same jobless rate as the national average.
South Carolina

Housing: Home prices in South Carolina were up 7.8 percent last year, nearly matching the national growth rate of 7.9. The median sale price for a home in South Carolina was $154,000, or lower than the national median sale price of $183,465.
Just over 69 percent of property in South Carolina is owned, compared with 64.9 percent nationwide. Nearly 48 percent of rental units in the state cost between $500 and $1,000 every month to rent; that's lower than the national average of 51.9 percent for rental units in that price range.
Income: Roughly 28.3 percent of South Carolina's population lives in a low-income household, defined as a household with an annual income of less than $25,000. In comparison, the national average for low income households is 23.4 percent. The second-most common household income level in the state is lower middle class, with around 26.4 percent of South Carolina residents living in a household earning an annual income between $25,000 and $50,000.
Jobs: South Carolina's unemployment rate is 1.7 percent higher than the national average.
South Dakota

Housing: Home sale prices in South Dakota appear to be trending downward. The median sale price in the state dropped 26.6 percent in 2014 from a year ago. In comparison, the national median sale price rose by 7.92 percent during that time period. The current median sale price for homes in South Dakota was $95,750, well below the national median sale price of $183,465.
About 68 percent of property in South Dakota is owned, compared with the the national average of 64.9 percent. The percentage of rental units in the state costing between $500 and $1,000 to rent per month stands at 44.6 percent, below the national average for 51.9 percent for rental units in that price bracket.
Income: About 27 percent of South Dakota residents live in a lower middle class household, defined as a household with an annual income of between $25,000 and $50,000. That percentage is above the 23.9 percent of lower middle class households found nationally. The second-most common household income level in the state is upper middle class, with nearly 24 percent of South Dakota's population living in a household earning an annual income between $75,000 and $150,000.
Jobs: South Dakota's unemployment rate is 4.6 percent lower than the national average.
Tennessee

Housing: Home sale prices in Tennessee are on the rise and increasing more quickly than the national average, rising 11.7 percent last year, compared to 7.9 percent for the country as a whole. The most recent median sale price for homes in Tennessee was $131,800, or lower than the national median of $183,465.
Property ownership in Tennessee, at 67.8 percent, or higher than the national average of 64.9 percent. About 52 percent of rental units in the state cost between $500 and $1,000 per month to rent, a rate close to the U.S. average of 51.9 percent for rental units in that price range.
Income: 28.2 percent of Tennessee residents live in a low-income household, defined as a household with an annual income of less than $25,000. This is a high percentage of low income households in comparison to the national rate of 23.4 percent. The second-most common household income level in the state is lower middle class, with around 27 percent of Tennessee's population living in a household earning an annual income between $25,000 and $50,000.
Jobs: Tennessee's unemployment rate is about 0.5 percent above the national average.
Texas

Housing: Home sale prices in Texas increased 8.1 percent in 2014, in line with the overall national growth rate of 7.9 percent. The median sale price for homes in Texas was $200,000, close to the national median of $183,465.
Property ownership in Texas, stands at 63.3 percent, or lower than the national average of 64.9 percent. Nearly 63 percent of rental units in the state cost between $500 and $1,000 per month to rent. That's well above the national average of around 52 percent for rental units in that price range.
Income: 24.5 percent of Texas's population lives in a lower middle class household, defined as a household with an annual income of between $25,000 and $50,000. That figure is close to the national average of lower middle class households, which stands at 23.9 percent. The next most common household income level in the state is upper middle class -- with around 24.4 percent of Texas residents living in a household earning an annual income between $75,000 and $150,000.
Jobs: The unemployment rate in Texas is 1.6 percent lower than the national average.
Utah

Housing: The median home sale price in Utah was up 5.4 percent in 2014. The most recent median sale price for a home in Utah was $237,857, above the national median sale price of $183,465.
More than 70 percent of property in Utah is owned, compared to the national average of 64.9 percent. Over 61 percent of rental units in the state cost between $500 and $1,000 per month to rent, a figure well above the national average of 51.9 percent for rental units in that price range.
Income: Around 28.7 percent of Utah's population lives in an upper middle class household, defined as a household with an annual income between $75,000 and $150,000. In comparison, 25.1 percent of U.S. residents live in upper middle class households. The second-most common household income level in the state is lower middle class, with 23.8 percent of Utah's residents living in a household earning an annual income between $25,000 and $50,000.
Jobs: Utah's unemployment rate is 2.3 percent lower than the national average.
Vermont

Housing: Home sale prices in Vermont rose 6.3 percent in 2014, compared with 7.9 percent for housing overall. The median sales price for homes in the state was $168,000, close to the national median of $183,465.
Property ownership in Vermont was 71 percent, versus 64.9 percent nationally. Nearly 60 percent of rental units in the state cost between $500 and $1,000 every month to rent, a figure well above the national average of 51.9 percent.
Income: 26.3 percent of Vermont's population lives in an upper middle class household, defined as a household with an annual income between $75,000 and $150,000; that's close to the national level of 25.1 percent. The second-most common household income level in the state is lower middle class, with 24.3 percent of Vermont residents living in a household earning an annual income between $25,000 and $50,000.
Jobs: Vermont's unemployment rate is 2.8 percent lower than the national average.
Virginia

Housing: The median sale price in Virginia increased by 2.8 percent last year, compared with 7.9 percent nationally. The median sale price for homes in Virginia was $253,900, higher than the national median of $183,465.
Property ownership in Virginia, meaning the owner or co-owner lives in the housing unit, stands at 67.3 percent, or above the national average of 64.9 percent. Just over 45 percent of rental units in the state cost between $500 and $1,000 every month to rent. That's below the national average of 51.9 percent of rental units in that price range.
Income: About 28.3 percent of Virginia residents live in an upper middle class household, defined as a household with an annual income between $75,000 and $150,000. That's higher than the national average of 25.1 percent for upper middle class households. The second-most common household income level in the state is lower middle class, with just over 21 percent of Virginia's population living in a household earning an annual income between $25,000 and $50,000.
Jobs: Virginia's unemployment rate is 2.6 percent lower than the national average.
Washington

Housing: Home prices in Washington State increased 8.1 percent last year, roughly tracking the U.S. as a whole. The median sales price for homes in Washington was $254,000, versus a national median of $183,465.
Property ownership in Washington is just over 63 percent, or slightly lower than the national average of 64.9 percent. Some 55 percent of rental units in the state cost between $500 and $1,000 every month to rent, a rate above the national average of 51.9 percent for rental units in that price range.
Income: 28.5 percent of Washington's population lives in an upper middle class household, defined as a household with an annual income between $75,000 and $150,000. That's a higher percentage of upper middle class households than the national average of 25.1 percent. The second most common household income level in the state is lower middle class, with about 22.6 percent of Washington residents living in a household earning an annual income between $25,000 and $50,000
Jobs: Washington State has nearly the same unemployment rate as the national average.
West Virginia
Housing: Home prices in West Virginia have been trending downward, with the median sale price in the state falling 4.3 percent last year. The most recent median sale price for homes in the state was $110,000, well below the national median of $183,465.
More than 73 percent of property in West Virginia is owned, a rate much higher than the national average of 64.9 percent. The majority of rental units in the state, at 57.7 percent, cost under $500 per month to rent.
Income: 31.9 percent of West Virginia's population lives in a low-income household, compared with 23.4 percent across the U.S. The second-most common household income level in the state is lower middle class, with nearly 27 percent of West Virginia residents living in a household earning an annual income between $25,000 and $50,000.
Jobs: West Virginia's unemployment rate is 1.2 percent lower than the national average.
Wisconsin

Housing: Sale prices in Wisconsin are rising more quickly than they are across the U.S. as a whole. The median sale price in Wisconsin increased by 10 percent from a year ago, compared to the 7.92 percent national growth rate. The most recent median sale price for homes in Wisconsin was $132,000, lower than the national median sale price of $183,465.
Property ownership in Wisconsin, meaning the owner or co-owner lives in the housing unit, stands at just over 68 percent, or higher than the national average of 64.9 percent. More than 60 percent of rental units in the state cost between $500 and $1,000 every month to rent, a higher rate than the 51.9 percent of rental units available nationally in that price range.
Income: Nearly 26 percent of Wisconsin's population lives in an upper middle class household, defined as a household with an annual income between $75,000 and $150,000. That figure is close to the 25.1 percent of upper middle class households across the U.S. The second-most common household income level in the state is lower middle class, with 25.4 percent of Wisconsin residents living in a household earning an annual income between $25,000 and $50,000
Jobs: Wisconsin's unemployment rate is 1.8 percent lower than the national average.
Wyoming

Housing: Home prices in Wyoming have remained about the same from a year ago. The median sale price for a home in Wyoming was $218,213, higher than the national median of $183,465.
Property ownership in Wyoming, where the owner or co-owner lives in the housing unit, stands at just over 70 percent, or higher than the national average of 64.9 percent. Just over 59 percent of rental units in the state cost between $500 and $1,000 per month to rent. That's higher than the national average of 51.9 percent for a rental unit in that price range.
Income: Close to 30 percent of Wyoming's population lives in an upper middle class household, defined as a household with an annual income between $75,000 and $150,000. That's above the national average of 25.1 percent. The next most common household income level in the state is lower middle class, with just over 24 percent of Wyoming residents living in a household earning an annual income between $25,000 and $50,000.
Jobs: Wyoming's unemployment rate is 4.2 percent lower than the national average