The rise of infographics: Lessons from the Social Media Weekend
by Leslie Bradshaw
(CBS/What's Trending) - If you've been watching the web, you've likely seen at least a few infographics hit your stream such as Hierarchy of Robot Needs, "FarmVille" vs. Real Farms and Lost Explanation.
They've become so popular that there are entire columns and blogs dedicated to them, including Fast Company's Infographic of the Day and FastCo Design, GOOD magazine as a whole and their infographics spotlight, Infosthetics and my partner Jesse's newly minted visual storytelling blog at Forbes -- just to name a few.
In fact, brands are also making serious investments in infographics and data visualization as a part of their marketing and communications strategy -- from IBM's Smarter Planet to GE's Data Visualization blog and sponsorship of Visualizing.org (not to mention their work with my company JESS3 on infographics such as The Future of Solar).
The launch of the visualization and infographic community Visual.ly by former Mint.com super powers Stew Langille and Lee Sherman also speaks to the rise of infographics, with an apropos video documenting the explosion of and position that infographics occupy in communications. At the nexus of journalism, analysis and design, infographics are undoubtedly relevant.
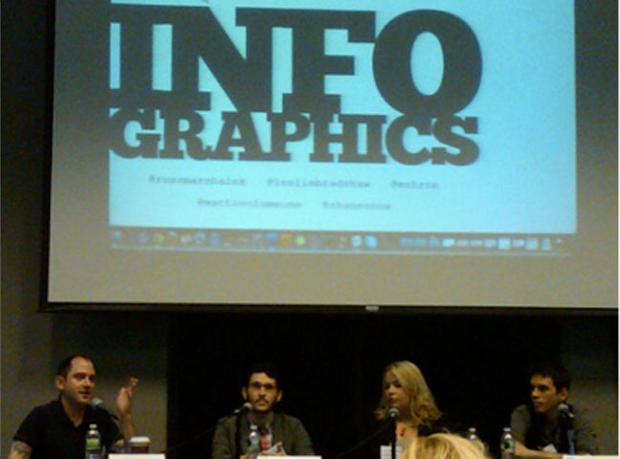
To discuss this phenomenon, Columbia School of Journalism hosted a panel coordinated by Emily Miethner on Infographics and Viral Media at its first Social Media Weekend. The event itself was lead by CSJ's digital media professor and one of Ad Age's "25 Media People You Should Follow on Twitter" Sree Sreenivasan (@sree), and covered a range of topics from mobile innovation to social media usage by journalists and citizens to bring light to issues unfolding in contentious countries.
Who better to flesh out the issue of the rise of infographics than moderator Shane Snow (@shanesnow), who is the co-founder of Contently.com and advisor to Visual.ly; panelists Russ Marshalek (@russmarshalek), the social media manager at Flavorpill, Matt Owens (@mattovolumeone), partner at the NYC design collective Athletics, Max Shron (@mshron), data scientist at OkCupid and fellow University of Chicago graduate (major: math -- which is awesome) and me (@lesliebradshaw), President, co-founder and COO of data visualization firm JESS3.
If you couldn't attend, here's the top takeaways from the panelists:
- Max Shron, OkCupid: "Our eyes are good at taking information in, better than any other way. We take information and put it in a form that fits in one eye-span. Infographics take information and make it decidable."
- Shane Snow, Visual.ly: "Visualization is a great storytelling medium and is also strong in driving digital traffic. The wonderful thing is that there are a million ways to tell a story with visualizations."
- Russ Marshalek, Flavorpill: "At its base, an infographic is a visual representation of some form of information, that may not necessarily be visual. It helps you understand the data better. They're not viral by nature."
- Matt Owens, Athletics: "In this time, there is a trend to make data cool and sexy and good to use. In what we do on a daily basis, what we do on the web, it is all about the hang time. Is it the joke of the moment that you need to jump on."
Leslie Bradshaw is President, co-founder and COO of data visualization firm JESS3. Follow her @lesliebradshaw.