Democratic lead continues to grow in race for House — CBS News Battleground Tracker
By Kabir Khanna and Anthony Salvanto
Democrats' position in the contest for the House of Representatives is the best it's been since June, but they remain dependent on turnout of less frequent voters, as well as winning over Trump voters from 2016.
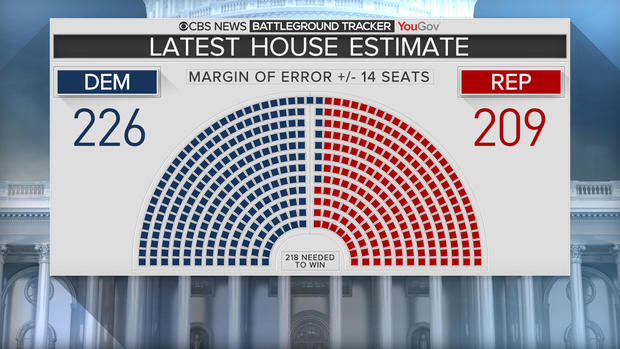
If the elections were held today, Democrats would stand to win 226 seats (more than the 218 needed for a majority) with Republicans winning the remaining 209. The margin of error on each of these estimates is plus or minus 14 seats, which means that there's still the prospect of Republicans retaining control. This range of possible outcomes in the model is wider than it was this summer. Many key races are extremely close, and it wouldn't take much movement from where things stand now to swing many seats in either direction.
Based on what we've learned from interviewing many different types of voters across the country, we ran two additional models using scenarios in which turnout ends up higher or lower than the model currently suggests, along with small shifts in key voting groups. The higher turnout scenario, in which low-propensity voters who tell us they are going to vote Democratic this year follow through and vote, sees Democrats winning 235 seats. In the lower turnout scenario, new midterm voters stay home and the electorate profiles like it has in recent midterms. The Republicans win 218 seats under these conditions, narrowly retaining their majority, but without any seats to spare.

Our Democratic seats estimate has slowly but steadily ticked up since we launched the CBS News/YouGov Battleground Tracker this summer. Our current estimate is four seats higher than it was in August, by which time candidates had been nominated to the general election in most districts. This uptick can be explained by a higher share of Trump voters crossing over to the Democrats. While this group is small in absolute terms (it's 8 percent of Trump voters nationally), it is larger than the share of Clinton voters supporting Republicans this year (about 3 percent) and has grown since August.
Our estimate comes from a large-scale poll of voters across the country and a statistical model that combines what voters tell us and characteristics of their districts. We focus our efforts on talking to people in key districts with competitive races. We end up with a range of possible outcomes, which have consistently included both narrow Republican holds and large Democratic victories. Democrats' highest potential gain has increased a little, while their lowest plausible gain is unchanged from last month.
Details on turnout scenarios
Turnout is a major variable that will influence each party's chances this November. Our main estimate is based on a model that incorporates the drop-off in turnout that is typical of midterm years. Specifically, younger voters, racial minorities and voters with less formal education vote at lower rates in midterm years than in presidential years. Democrats are hoping to change this dynamic, with respect to youth and non-white turnout. On the other hand, drop-off among voters without college degrees may hurt Republicans. To illustrate how different turnout patterns can change how many seats each party is likely to win, we recalculated our estimates under two different scenarios.
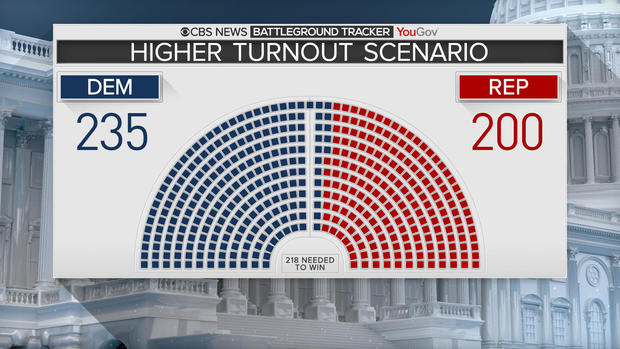
Higher turnout scenario: 235 Democratic seats, 200 Republican seats
In this scenario, we assume that turnout increases overall and among demographic groups favoring Democrats — younger voters, non-whites, and college degree holders — relative to recent midterms, as well as differential turnout by past vote. There is good reason to think that turnout will be higher this year than in recent midterms. For one, voters across parties are expressing enthusiasm: 62 percent of Republicans and 61 percent of Democrats in key House races. Moreover, turnout has been very high in multiple House special elections in the recent past.
Specifically, we assume that the national share of voters under age 30 ticks up a couple of points from its size in recent midterms. The size of the non-white vote is similar to that of recent presidential elections, and the size of the college vote is up one point from 2014. The cumulative effect of these patterns would be to net Democrats a handful of extra seats.
On top of these demographic patterns, this scenario assumes that Clinton voters turn out at a higher rate than Trump voters do. While there isn't currently an enthusiasm gap between parties in key House races, Democratic voters have consistently been more likely than Republican voters to describe the upcoming election as more important than a presidential election, since we started polling in the summer. It is possible that these attitudes will translate into Clinton voters turning out at a higher rate than Trump voters. In this scenario, the difference between these group sizes increases by one point, over and above the effects of the demographic changes above (e.g., from three points to four points).
We estimate that this scenario would yield 235 Democratic seats to 200 Republican seats. This result would be a 40-seat gain for the Democrats, exceeding their success even in the 2006 wave election.
Lower turnout scenario: 217 Democratic seats, 218 Republican seats
In this scenario, we assume that the demographics of this year's electorate generally mirror those of recent midterms and that people who haven't voted in a recent midterm stay home again this year. These assumptions would result in lower overall turnout and work in favor of Republicans. Specifically, youth turnout stays close to its recent levels (10 percent under 30), and white voters make up a similar share of the electorate as in 2010 (78 percent). Contrary to recent trends, the share of voters without a college degree is similar to its share in 2016.
Additionally, new midterm voters stay home in this scenario. By "new," we mean registered voters who tell us that they didn't turn out in 2010 or 2014. This group leans Democratic in their current vote intention: they favor Democratic candidates over Republican ones by 21 points in key House races, while the parties are even among all other likely voters. If these potentially new voters decide not to vote this year, in addition to the demographic patterns above, we estimate that Republicans would win 218 seats, just barely hanging onto control. Democrats would gain 22 seats but fall one seat short of winning a majority.
We should note that some of these assumptions are unlikely. Not all new midterm voters will stay home, even if many do. We discuss these scenarios to illustrate each party's bases of support and how differential turnout could impact each party's electoral fortunes.
Toplines here: