Big bets on stock market bliss go bad
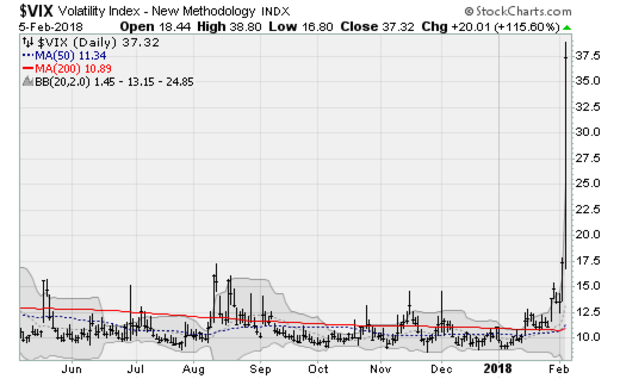
What sparked Monday's mayhem on Wall Street? The primary catalyst was a continuation of the selling wave on Friday related to inflation fears, higher bond yields and faster-than-expected wage growth. But more than that, you can blame a breakdown in an increasingly popular strategy that uses derivatives and other investing trickery to bet on ongoing market bliss, low volatility and easy gains.
So-called "short volatility" funds, such as the Velocity Shares Daily Inverse VIX Short Term (XIV), melted down roughly 90 percent in after-hours trading on Monday in what looked like panicked liquidation. The fear is that the underwriters -- Credit Suisse (CS) in this case -- will have to liquidate the fund in which it's a major investor. If so, the hit would be worth about two quarters of profits for the institution. Credit Suisse said Tuesday morning it didn't suffer losses stemming from XIV.
The action in XIV led to further selling in the broad equity futures in the overnight session, with Dow Jones industrials futures triggering their circuit breaker in Japanese trading (down 7 percent or more). The next trigger would be a 12 percent decline followed by a 20 percent decline, at which point trading would stop for the day.
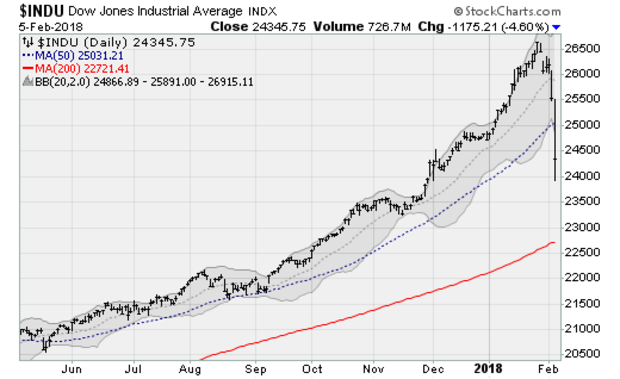
Monday's selling pressure was overwhelming: Decliners outpaced advancers by a 9-to-1 margin, while down volume swamped advancing volume by 12-to-1. That ended the 410-day run without a 5 percent downturn.
The ferocity of the decline, according to Morgan Stanley analysts, was a drop in market liquidity as computer trading algorithms fed on each other heading into the close of cash trading on Monday. Liquidity was down 50 percent in some places from Friday, pulling down the average order size. That left a $3.4 billion sell-side imbalance heading into the close and drove the after-hours decline, which has eased as morning approached in the U.S., with Dow industrials futures down by around 300 points.
What's next? Well, in a typical environment, a relief rebound should be expected. But the collapse of the short volatility trade as per the XIV calls that into question (chart below). A whiff of 2007-style contagion is in the air.
Jason Goepfert at SentimenTrader noted that Monday's moves were of a ferocity rarely seen in history. And they have tended to lead to "capitulation" lows (when investors who've been holding out finally give in and sell) that lead to medium-term rebounds. The S&P 500 has lost 6 percent within six days of setting its last new high.
That last happened in July 2007, which marked the top of the previous bull run -- a frightening parallel. But other examples from history, including 1986 and 1955, showed higher prices in the months that followed. Overall, stocks had risen two months later 83 percent of the time.
But machine-based selling could spoil the pattern this time. JPMorgan quantitative strategist Marko Kolanovic estimated that soaring volatility could trigger some $100 billion in U.S. equity selling as so-called "systemic traders" are forced to rebalance their positions. Yet he sees a silver lining in it all, noting that "strong" underlying fundamentals -- such as attractive valuations, earnings and the U.S. tax cut -- argue for a recovery in time.
That could, perhaps, make this current unpleasantness a tactical buying opportunity ahead of fresh hurdles such as the specter of higher interest rates and a new debt ceiling standoff.