Why Congress is divided and won't change: It's you

Even the close ones aren't that close.
Americans routinely give Congress rock-bottom approval ratings, often because they say its too partisan. But every two years most districts stay in the same hands - the same party, often the same member - and none of that shows signs of changing soon. Below we'll show just how hard it is to flip a House district from one party to another; how that same partisanship is itself a big reason why, and how voting lines have become so hardened that even close "competitive" districts tend to stay put, too. It all sets the backdrop for 2014, and for House politics today.
Over the last twelve years, more than 3,000 House elections, only a meager 7 percent - or just over 200 total - have resulted in party turnover. (Republicans have gotten only slightly more of those swaps than Democrats.) And that's not historically unusual. Redistricting and gerrymandering are often cited in all this, but remember that drawing fancy district lines around voters only works if they vote in regular, partisan ways each time. And they do. Consider, for example, in 2012, 94 percent of Democrats voted for Democratic House candidates, and 94 percent of Republicans voted for Republicans, which was about normal for recent elections. We've also long heard that Americans hate Congress but love their own congressman, but that's not quite it these days; it might be better to say partisan voters love their own partisan candidates.
Now here's what stark partisan divisions have looked like, district for district, over the last decade. For each district in each cycle going back to 2000, we pulled out the partisan profile of its voters at the time: the typical, average Republican/Democratic split as it stood heading into that November. This profile (sometimes called a partisan index) was based on the district's previous splits in many races. Closely competitive districts have narrow profiles closer to 51-49, balanced between the parties, while more extreme districts, lopsided with voters of one party or the other, end up with profiles of 60-40 or more to one side.

The important thing to note in the chart is the U-shape: on the more lopsided partisan ends, there are many more total districts - this is, in part, the visible result of years of that redistricting and gerrymandering, but also of partisan voting. There are fewer districts toward the middle where the profile is closer between Republicans and Democrats, between 55-45 or even 52-48. So starting off, we know there aren't a lot of House districts in play, where members have to worry a lot about re-election. Each color bar set represents a year, so you can also see this doesn't vary much by year, which is also important to note in the stability of partisan patterns.
But here's the thing: turnover is so tough that even close districts don't change party hands often. The next chart shows, on average, the percent of districts in each of those partisan categories that actually did flip. This graph looks more like a small hill: in the middle, where those partisan profiles ran more even between the parties, we see relatively more turnovers, but it's still a very small hill: the flip rate for districts with "competitive" partisan profiles of just 51 or 52 percent edges for one party is still only about one in five. In other words, in recent years Democrats have only lost a handful of districts even when they were clinging to a slim point or two of partisan advantage. Similarly, Republicans have lost few of their own such close districts.
A profile point or two may seem like little, but it tends to hold up.
Average Turnover Rate per District Profile Type
2000-2012
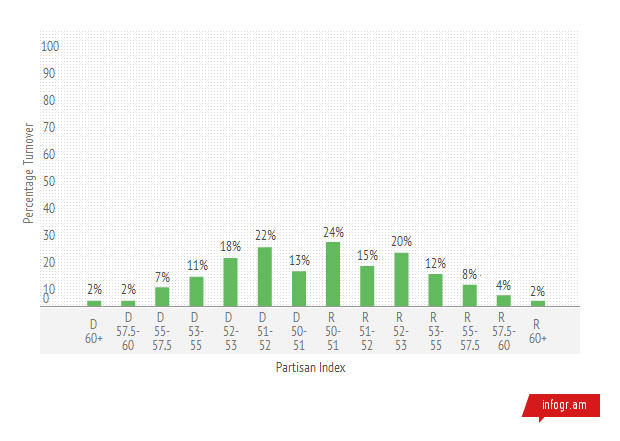
Looking further out toward the left and right side of the chart, we see even less turnover. Partisanship is too hard a hill to climb for the opposition. Democrats lost only 7 percent of all districts that had Democratic profiles of 55 to 57 percent, and Republicans lost a similarly small 8 percent of all districts that had Republican 55 to 57 percent profiles. Beyond that, flips become rarer still. At the extremes, this is glaring: in all of the last 10 cycles of House races, Republicans have won exactly one seat in a district that was routinely more than 60 percent Democratic. Democrats have won a paltry three races in districts on the opposite end, more than 60 percent Republican. It's hard to swing a few voters, and near impossible to swing a lot of them.
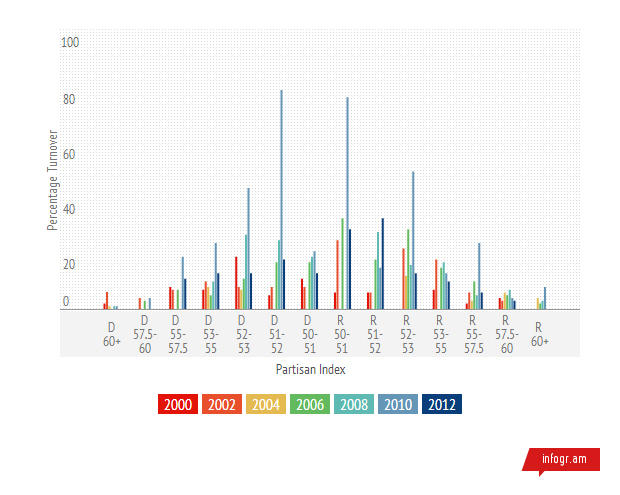
Viewed year by year instead of on average, flips look rarer still, because we've seen a couple of unusual years in the last decade. Most glaringly, 2010 was a banner year for Republicans (displayed here by the orange bars) who made the most of flipping close districts and got an unusually high percent of them, getting as many as 80 percent of close ones, which contributes to the overall average in the last chart. In most years, as you see, we might expect not more than four in 10 of even close districts to flip.
Year-by-Year Turnovers per Partisan Category
This story unveils a little more - and turnovers look even harder to come by - when we also consider the peculiarities of individual years. Often these turnovers take the form of a district "reverting" back to its underlying partisan leanings after a temporary change, or the retirement of a long-standing incumbent who's personal popularity has bucked partisan trends of voters in their districts. But once they retire and leave the scene, the district quickly falls into line with its partisanship, often resulting in a gain that should be read as aligning with partisanship rather than a true swing of voters. When we see the chart this way, we effectively have an even small number of flips that went against partisan leanings, underscoring the entrenchment of partisan patterns.
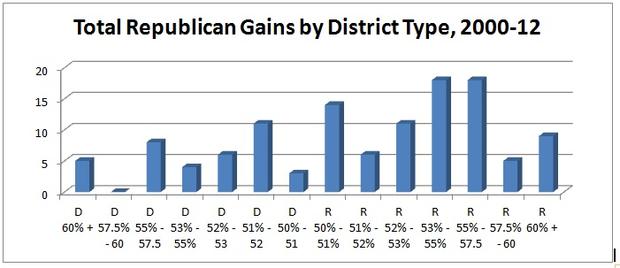
Here are the district types where Republicans made gains in the last 10 years - they skew toward districts that already had Republican partisan profiles. This shows that to make gains Republicans didn't always swing Democratic voters in Democratic districts, but rather Republicans grabbed seats in Republican-leaning districts when they opened up, often after an incumbent retirement.
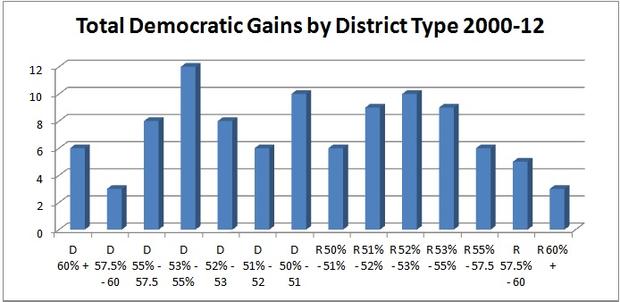
Things look only somewhat similar for Democrats: when they've flipped seats in the last ten years (and it hasn't been all that often) it has sometimes been in Democratic-leaning seats, capitalizing on a retirement or an open seat. Democrats have done a little better at swinging over Republican-leaning seats, but the bulk of these were in 2006 and some in 2008, unusually good years for Democrats, and ones not likely to be repeated after the latest round of redistricting.
Breaking down the years: The Big Stalemate
So not all turnovers are created equal, and some are more surprising than others. Looking through specific years illustrates some of this.
In 2012, the effects of redistricting were on full display when Democratic candidates got more total votes than Republican candidates but Republicans won the House majority. Democratic voters are more "packed" into their single-member districts, so the Democratic congressman elected with 75 percent of the vote counts just as much (one House seat) as the Republican congressman elected in her district with 51 percent. But much like a team can be outscored in a seven-game World Series and still lose, we keep the meaningful tally in districts, not total votes.
In 2010, 16 of Republicans' turnovers came in places more than 55 percent Republican profile. Some of that was an effect of old southern Democrats retiring, but it was also was unusual that Democrats had held many of those seats at all, stemming from their own good years of 2006 and 2008. That 2006 Democratic gain was more broad-based with 20 of their 30 gains in districts less than 50 percent profile Democratic. Twenty-two wins occurred incumbent-held districts, with eight open seat victories. They lost none. Moreover, the 2006 Democratic victory was not tethered to a previous wave in that it materialized all at once, whereas the 2010 Republican wave was more of a reversion to norms.
In 2008, most of Democrats' gains, 15 of 26, were in districts less than 50 percent Democratic, or true reversals. The way district profiles look now it may be that 2008 was the last time for a while we'll see a party so successful in penetrating hyper-partisan districts. Four of the five Democratic losses occurred in districts under 50 percent Democratic.
In all, thanks to little turnover, reversion to partisan norms, and overall parity between the parties in a closely-divided nation, things in the balance of power in the House are almost even since 2000. The last 6 cycles have resulted in a net stalemate, and the House is only slightly different now than it was as far back in 1994 after Republicans won 52 seats, breaking a run of 40 years of Democratic control.
Now all of this is not to say House members don't have to fight it out in many cases, and they do see hotly contested races. (We'll spotlight some of the most important ones for 2014 next in Part 2.) But what may be surprising to many is just how few of the so-called "close" or competitive districts, the ones where the parties are within a few points of each other, actually end up flipping without a wave year -- and even that is often composed of other factors that involve partisanship, not skirt it.
American elections are almost always contested, as the old saying goes, "between the 40-yard lines," or in other words around the 50-50 mark with just a few points to either side. But what we see here is that moving over that 50 percent mark is quite hard. It's not as easy as getting a couple of yards in football, to continue that analogy, but more like a couple of runs in baseball or goals in hockey -- far harder to come by. In House races, over at least the last decade in a divided America, even a couple of points seems to constitute a hard partisan line.
FOOTNOTES
***In the measures considered here as we look back in time, district partisan indexes are considered at the time of the year in question, so 2002's partisan indexes are from 2002, 2008's are as they were in 2008's and so on. Therefore the comparisons here are by district types, compiled across all the years, and not particular districts year to year. (In other words, if for example make-believe district CA-99 was a 51 percent Democratic in 2002, we count what happened there in 2002 as a 51 percent district, and if it had become a 54 percent district in 2010, the outcome 2010 is tallied to what happens to 54 percent districts.)
***District turnover here does not include reapportionment and wins/loses in new districts as there is no previous party control for these.
(***A word about our partisan index, the basis of this analysis. Many analysts use the presidential vote as a guide to rate the "partisanship" in a district, which is a fine proxy, though we prefered to use a wider range of past vote to form our index, to account for voting variations year to year and get a more robust look at how much partisan movement is really possible in a district. Our partisan index was formed out of an average of district votes for national and statewide races like governor, senator, as well as president, and of course previous House votes. This allows us to better profile districts and separate the partisans who'll vote across party lines once in a while, if the timing and candidate is right, from those who just never ever will.)