The U.S. economy is "broken" -- here's the proof
Many Americans correctly perceive the U.S. as a land of "haves" and "have-nots," reflecting the erosion of the middle class and a growing public awareness of economic inequality. Less widely understood is where the "have-just-about-everythings" fit into the mix.
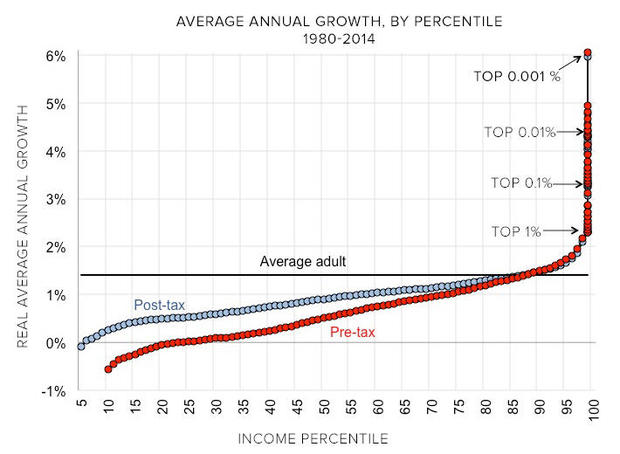
As a chart making the rounds starkly shows, it is only those at the apex of the income ladder – the 0.1 percent atop the 99.9 percent – that have seen a significant gain in their income over the last three decades. The numbers speak for themselves.
Between 1980 and 2014, income for the middle 40 percent of U.S. households – meaning those with average pre-tax earnings of $65,300 – rose a total of 42 percent. That's about 1.2 percentage points per year.
By comparison, income for the top 1 percent during that period – people with average income of $1.3 million – rose 204 percent, or 6 percent a year. But the really big gains accrue still higher up the ladder.
Income for the top 0.1 percent ($6 million in average income) jumped 320 percent between 1980 and 2014. And it positively exploded for the richest Americans: Income for the .001 percent (average income of $121.9 million) shot up 636 percent, or nearly 19 percent per year.
What do such figures say about the American economy?
"The most important takeaway is that the U.S. economy is broken," said Gabriel Zucman, co-author of the study that produced the chart and one of the country's leading experts on inequality, by email. "Since 1980, there has been no growth for half of the population (the bottom 50 percent of income earners) and only very limited growth for the bottom 90 percent, while a tiny minority (the top 1 percent) has seen its income skyrocket."
Here's what the chart means in dollars and cents: Since 1980, average pre-tax income for people in the the top 1 percent has tripled, to about $1.3 million a year (as of 2014). For those in the bottom 50 percent, income has idled at around $16,000.
In other words, it's back to the future, with the income gap in the U.S. roughly at the same level as in the late 1920s. Just before the Great Depression, the wealthiest 1 percent of Americans collected nearly a quarter of the nation's income, while the bottom 90 percent got just over two-thirds. Today, the 1 percent have roughly 20 percent of national income.
Sure, skeptics might ask -- wasn't America always somewhat lopsided in its distribution of wealth, rightfully rewarding those individualists bumptious enough to build empires while leaving comparatively less for the rest of us?
Not really. Between 1946 and 1980, income for the bottom 10 percent rose faster than that of the top 10 percent. Poorer Americans saw the biggest gains – a 179 percent growth in income during those years. The bottom half of income-earners saw their income grow more than 100 percent, compared with 57 percent for the .001 percent.
"From 1946 to 1980 incomes were growing at roughly the same pace for everybody, and macroeconomic growth was strong," said Zucman, an economist at the University of California-Berkeley (whose co-authors for the study included two other leading inequality scholars -- Thomas Piketty of the University of Paris and Emmanuel Saez, also of UC Berkeley). "This shows that it is possible to have an economy that is both dynamic and equitable."
Not surprisingly, the tidal shift in who earns what in the U.S. is expressing itself in other ways — like who lives longer. Over the last 30 years, the life expectancy of low-income workers has stagnated, and even declined in some parts of the country. (Life expectancy is an estimate of how many more years a person has to live at a given age, while the mortality rate refers to the number of deaths over a given period of time.)
As a result, a 40-year-old man in the top 1 percent of U.S. income earners can expect to live to 87, economic research shows. Among the bottom 1 percent, a man of the same age can expect to make it to 72. The main reason for that divergence, as economists Anne Case and Angus Deaton showed last year: a surge in deaths among people in this group from drug and alcohol abuse and from suicide.
That's not merely a sign of a troubled economy -- it's broken.