Are U.S. investors finally coming to their senses?
No wonder U.S. investors have been feeling giddy. Until today's market slide, large-cap stocks were just off their record highs. Stocks stateside seem inoculated against geopolitical developments, whether turmoil in the Middle East, Ukraine or Hong Kong, and equally unperturbed by stalling growth in China and Europe. Here at home, GDP has grown at an annualized rate of at least 3 percent in three of the last four quarters.
Not even turbulence in the bond, currency, and commodity markets -- related in large part to what's happening with the Federal Reserve -- has rattled large U.S. stocks. Nor has weakness in small-cap U.S. stocks, which are down more than 5.3 percent for the year and just suffered their worst quarterly performance in three years.
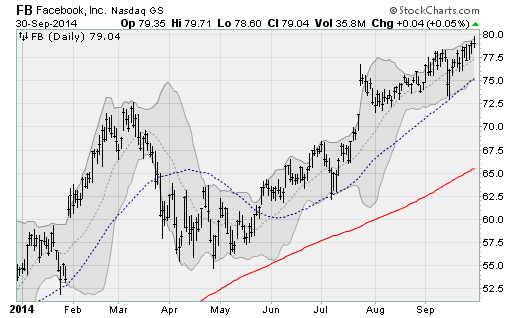
All of this helps explains why investor sentiment is soaring, why margin debt balances are at record highs and why so many people seem to think markets only go up. And why shouldn't they? For more than two years, every pause in the upward progress of large-cap U.S. stocks has been quickly reversed as volatility has compressed to historic lows. There just aren't many fear-inducing ups and downs anymore. Just look at the charts of stocks like Facebook (FB) and Disney (DIS). They are about as perfect as you get.
But warning signs suggest the good times may not last.
A major red flag -- and I hate to keep harping on this but it's not going away -- has been the terrible market "breadth" measures, as buyers find fewer and fewer stocks enticing at these prices. Breadth measures how broadly stocks are participating in the upside. The more stocks, the broader the support, and the stronger the overall market.
In July, 85 percent of the stocks in the S&P 500 were in uptrends. At the start of September, it was 76 percent. But now the figure is down to 68.6 percent. And yet the index itself has barely budged, down just over two percent from its intra-day record high.
This disconnect, which chart watchers call a negative divergence, is a big warning sign that the uptrend is losing momentum beneath the surface. That's because buyers are basically saying that too many stocks are too expensive at these levels and that to reinvigorate interest, lower prices are needed.
There are other ways to look at this. Consider that the percentage of stocks on the New York Stock Exchange above their 50-day moving average dropped last week to less than 25 percent, levels not seen since June 2013. That's down from 65 percent at the start of the month and a high of 83 percent back in July. Yet the Dow Jones industrial average is at the same price level, near 17,000, that it was back in July.
Back in the summer of 2013, when NYSE breadth was last at the depths we're plumbing now, the Dow was near 14,800. That's 13 percent below current prices.
There are other concerns, from new reports of the Ebola virus reaching the U.S. to the approaching end of the Federal Reserve's bond purchase program in a few weeks, investors keep in mind as well.
One way to view this is that the underlying strength of large U.S. stocks is so robust that nothing can rattle them. And if that's the case, there's no need to worry and it is truly a great time to be an American investor.
But I have a nagging sense that this type of hear no evil, see no evil, speak no evil behavior is simply a sign of overconfidence before the fall. Indeed, cracks are already starting to appear. On Wednesday, amid more selling pressure, the Russell 2000 small cap index broke its uptrend support going back to 2011. Just another blemish on what many believe is a perfect, untouchable stock market rally.


