Wall Street's 2017 is starting to echo 1987
U.S. equities churned near the unchanged line on Thursday, with the Dow Jones industrials index recovering from early session weakness to notch another new record high. No major catalysts were in play as investors continue to monitor the situation in Washington for clues on the path of tax, regulatory and health care policy. The last 1 percent decline was way back on Oct. 11.
For those keeping track at home, the result marked the Dow’s 10th consecutive record close, something that has happened just one other time in the 100-plus year history of the index: January 1987. But that’s not exactly an example we want to mimic: Just 10 months later, the Dow suffered a 30 percent crash.
Then, like now, Wall Street was breathlessly pricing in the prospect of deregulation and tax reform from a Republican President, Ronald Reagan. And then, like now, the Federal Reserve was tightening policy in response to a rebound in oil prices.
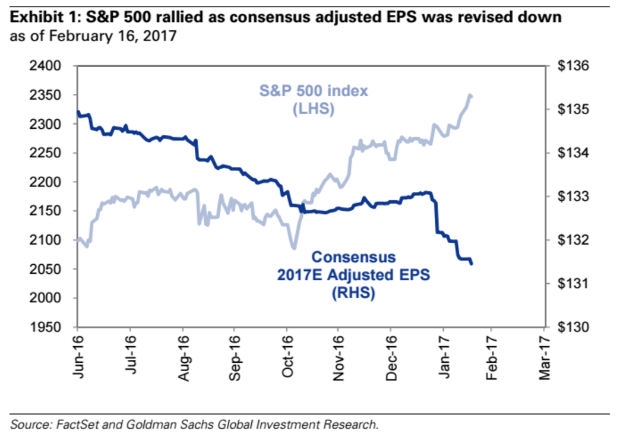
The current post-election market “meltup” has been driven purely by excitement over plans out of the Trump White House, as earnings expectations have actually been sliding, which is pushing valuations metrics higher (chart above), something even the Federal Reserve mentioned in its latest meeting minutes.
This was bolstered recently when President Trump said his tax plans would be unveiled within a “couple” weeks -- igniting the month-long push in equities. But now, realization is growing that any tax cut efforts are likely to be a 2018 story, as highlighted by Goldman Sachs analysts led by David Kostin in a recent note to clients.
Comments from Treasury Secretary Steve Mnuchin over the last few days suggest the timing of tax reform legislation could be later in 2017 than many had expected. In an interview with Reuters, President Trump said he supported “some form” of a border tax and that both tax reform and health care would be tackled together -- no doubt due to rules in the Senate related to avoiding a filibuster -- which will make the legislation more complex and unwieldy.
Supporting this takeaway was an article in Axios suggesting the GOP may delay a push on infrastructure spending until closer to the 2018 midterm elections to increase the pressure on Congressional Democrats to support their efforts to provide jobs and projects for their home districts. The report pressured stocks in the machinery, engineering/construction and steel industries.
Translation: This is going to take time. Thus, markets may have gotten ahead of themselves in pricing in the positives of Mr. Trump’s agenda.
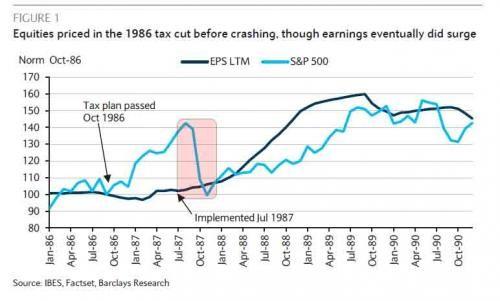
Looking back at the 1987 parallel, President Reagan’s tax plan was passed in October 1986 and implemented in July 1987. Stocks collapsed in a “sell the news” dynamic, according to research from Barclays Capital, because all the positive factors had already been priced into stretching valuations (chart above).
The Federal Reserve responded to a rebound in energy-driven inflation over that period by raising interest rates from 5.9 percent to 7.2 percent between October 1986 and September 1987.
Are we headed for a similar outcome as the Fed mulls a rate hike in March? No one can say for sure. But one factor makes 2017 look worse than what happened in 1987: The national debt is much greater now -- and it will surely rise, at least over the short term, as a result of what we can assume about President Trump’s tax cut plans so far.
That raises the specter that the market, at some point, starts worrying about the downsides of lower taxes: Higher inflation, further policy tightening from the Fed and the risk of financial instability of the kind seen in 2011 when Standard & Poor’s downgraded the U.S. Treasury’s credit rating.