Income inequality: 1 percent still going strong

The top 1 percent had a rough Great Recession, according to recent research by Emmanuel Saez, an economist at Berkeley. But no need to rush out and hug a millionaire - the recovery has been very good to the top U.S. earners. In fact, going back to 1993, the top 1 percent have seen outsized gains when compared to the 99 percent.
During the Great Recession (2007 to 2009), everybody lost. Average real income per family plummeted by 17.4 percent, which is the largest two-year drop since the Great Depression. That's why this recession got its own name. But Saez's research shows that the top 1 percent really took it on the chin, with average real income plunging by 36.3 percent decline. That meant that the share of income earned by those in the top percentile income dropped from 23.5 to 18.1 percent. The major culprit for the top earners is the collapse of realized capital gains due to the stock-market crash.
Obviously there was no hiding during an economic contraction as severe as seen in 2007-2009. Average real income for the bottom 99 percent fell by 11.6 percent, also by far the largest two year decline since the Great Depression. Here's the most depressing fact about the recession for the 99 percent-ers: It more than wiped out the 6.8 percent income gain from 2002 to 2007.
During the first year of the recovery (2010), there was a reversal of fortunes. (Saez's analysis only includes 2010 because the information comes from the IRS, which has not yet published data for 2011.)
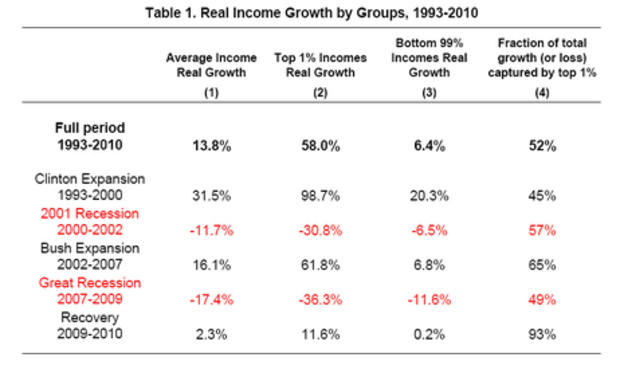
Average real income per family grew by 2.3 percent, but the top 1 percent saw income gains of 11.6 percent, while bottom 99 percent only saw a tiny 0.2 percent rise. In other words, the top 1 percent captured 93 percent of the income gains in the first year of recovery. The top 10 percent in the U.S. take now take home nearly half of all income (47 percent), driven by the top percent who account for 20 percent. As a means of comparison from 1917-1981, the bottom 90 percent, captured 69 percent of income gains; from 1982-2000: the bottom 90 percent, captured 23 percent of income gains and from 2001-2010, the bottom 90 percent had income losses (h/t Barry Ritholtz). No wonder Occupy Wall Street captured the hearts and minds of so many Americans.
Saez notes that there was no similar outcry during the booming 1990's because incomes of the bottom 99 percent grew by 20 percent between 1993 and 2000, but only by 6.8 percent between 2002 and 2007.
How did this income gap occur happen? Technological advances and the opening of the global labor market changed the landscape for U.S. workers, but we also know that the money that companies have earned during the recovery has mostly stayed within corporate America and has not trickled down into higher wages, nor has it created enough jobs to put some of the 12.8 million unemployed Americans back to work. Economists at Northeastern University found that from the second quarter of 2009, when the recovery began to the fourth quarter of 2010, "corporate profits captured 88 percent of the growth in real national income while aggregate wages and salaries accounted for only slightly more than 1 percent." It stands to reason that these gains flowed more to those who own financial assets, i.e. the top one percent.
In other words, the sarcastic take on the "Golden Rule" was proven over the past decade: Those with the gold, rule.
Here's a refresher on the income breakdowns:
-- Top 1 percent = $368,238 (20.9 percent of total U.S. income)
-- Top 0.5 percent = $558,726 (16.8 percent of total U.S. income)
-- Top 0.1 percent = $1,695,136 (10.3 percent of total U.S. income)
-- Top .01 percent = $9,141,190 (5 percent of total U.S. income)
-- Top 10 percent = $109,062 (11.7 percent of total U.S. income)