Both Trump and Clinton seen as risky choices - CBS/NYT poll
By Sarah Dutton, Jennifer De Pinto, Fred Backus and Anthony Salvanto
The State of the Race
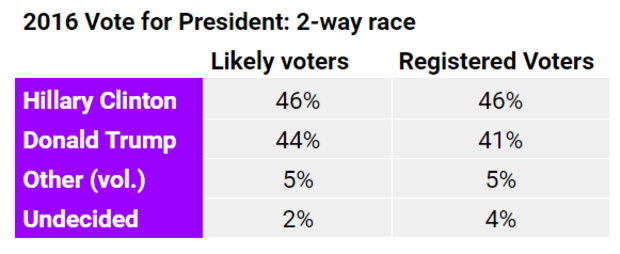
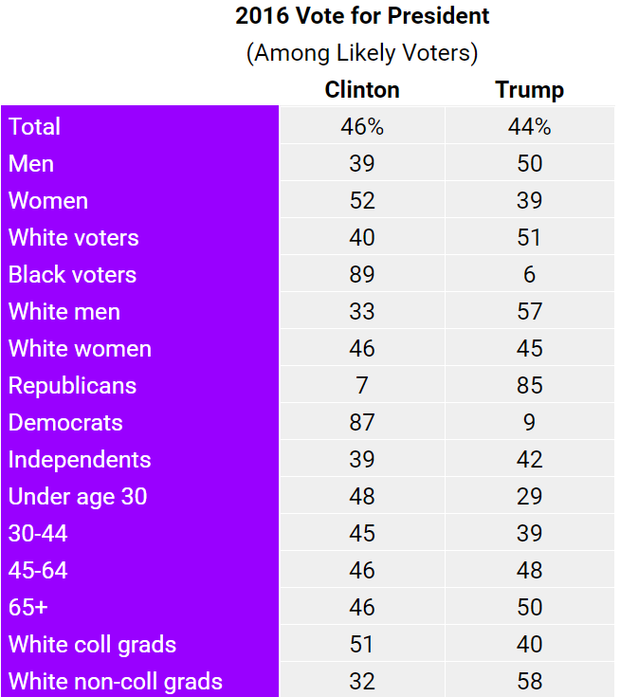
With Election Day just under eight weeks away, the race for President nationwide is tight. In a two-way match-up, Clinton has a slim edge over Trump, 46 percent-44 percent among likely voters who support or lean toward a candidate.
This is the first national poll in which CBS News and the New York Times have measured the presidential race among likely voters. The measure for likely voters takes into account voters’ reported intent to vote, enthusiasm about voting and other factors that historically affect an individual’s decision to vote.
Among the broader electorate – registered voters nationwide – Clinton leads Trump by five points, 46 percent to 41 percent.
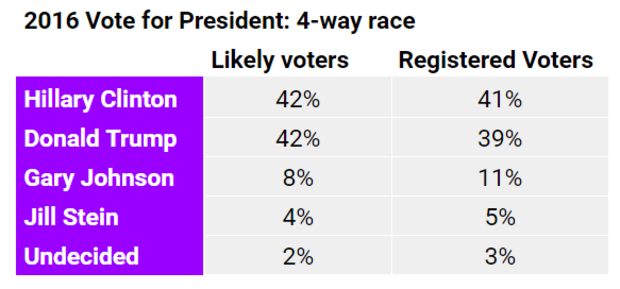
When third party candidates Gary Johnson and Jill Stein are factored in, the race is tied, with Trump and Clinton each getting the backing of 42 percent of likely voters. While Clinton and Trump retain most of their support when Johnson and Stein are included, slightly more of Clinton’s supporters move to Johnson or Stein, compared to Trump’s supporters.
Among registered voters, Clinton has a slight edge over Trump in a four-way contest.
Most Clinton and Trump voters say they’re sticking with their candidate. Ninety-two percent of Trump voters and 94 percent of Clinton voters say their choice is set. Few say they will change their minds before the election.
The Tone of the Campaign and Voter Attention
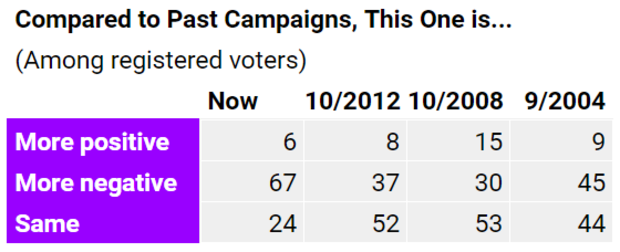
The 2016 presidential campaign is viewed as the most negative in recent memory. Two-thirds of registered voters describe the current presidential campaign as more negative than previous ones, a whopping thirty-point increase from how voters assessed the 2012 campaign in October of that year.
Sixty-one percent of voters are paying a lot of attention to this year’s presidential campaign, similar to what was recorded at the beginning of August. More Republicans (67 percent) are paying a lot of attention than Democrats (61 percent) or independents (54 percent).
Trump and Clinton Seen as Risky, Unfavorable Ratings Remain High
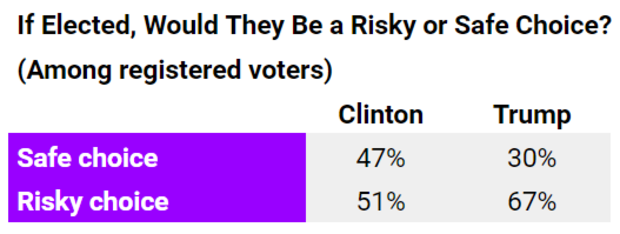
With 54 days to go to Election Day, many voters describe electing either candidate as a risky choice for the country, although more say that about Trump (67 percent) than Clinton (51 percent). A near unanimous percentage of each candidate’s supporters see the opposition as a risky choice.
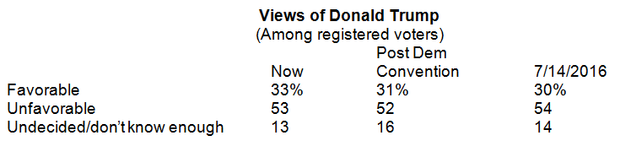
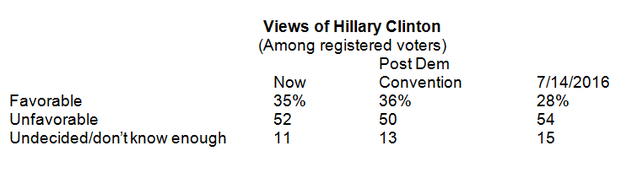
After more than a year of campaigning, neither candidate has improved their overall image with voters - more than half continue to hold unfavorable opinions of Trump and Clinton. When compared to past nominees at a similar point in the election cycle, Trump and Clinton’s unfavorable ratings continue to be the highest in CBS News polling going back to 1984, when the question was first asked.
Candidate Qualities
Trust continues to be an issue for Clinton; 63 percent of voters say she is not honest and trustworthy, but most voters (60 percent) also view Trump as untrustworthy.
Neither candidate is viewed by voters as sharing their values.
The candidates are viewed quite differently on two other characteristics measured in this poll. Forty-eight percent of voters think Trump would bring change to Washington, while fewer voters (36 percent) see Clinton that way. Clinton continues to have an advantage on having the right temperament: 55 percent think she does, compared to just 31 percent who say that about Trump.
Emails and Tax Returns
News about Clinton’s handling of her emails while Secretary of State continues, and most voters think Clinton did something wrong when she set up a personal email address and server for work while she was Secretary of State, including 45 percent who think what she did was illegal. Republicans are especially likely to think what Clinton did was illegal. These views are similar to what they were in July.
Trump has not yet released his tax returns, and most voters think he should. Fifty-nine percent think it’s necessary for him to release his returns, including majorities of Democrats (78 percent) and independents (58 percent). Most Republicans (57 percent) don’t think Trump needs to release his tax returns.
The Candidates on the Issues
The economy and jobs (32 percent) is the most important issue for registered voters when it comes to deciding their vote for president this year, though nearly as many are most concerned about national security and terrorism (29 percent). Much further down on the list is health care (16 percent), while immigration is the top concern of just 8 percent of voters.
Donald Trump is viewed as more likely to do a better job on the economy (51 percent) by an eight-point margin, while Clinton has an edge on terrorism and national security, 49 - 45 percent. Clinton is seen as better able to handle immigration and foreign policy
Illegal Immigration
Just 25 percent of Americans think illegal immigrants are more likely to commit crimes than U.S. citizens – most think they are about as likely. Trump voters are more than three times as likely as Clinton voters to think illegal immigrants commit more crimes than U.S. citizens, though still less than half of all Trump voters say so.
Six in 10 voters think illegal immigrants should be allowed to stay in the United States and apply for U.S. citizenship, an idea at odds with what has been proposed by the Trump campaign. Another 12 percent think they should be allowed to stay but not have a path to citizenship, while 22 percent think illegal immigrants should be required to leave the U.S. Even half of Trump voters think illegal immigrants should be allowed to stay in the U.S., though just 38 percent think they should be allowed to apply for citizenship. Among Clinton voters, 81 percent think they should have a path to citizenship.
Enthusiasm and Strength of Support
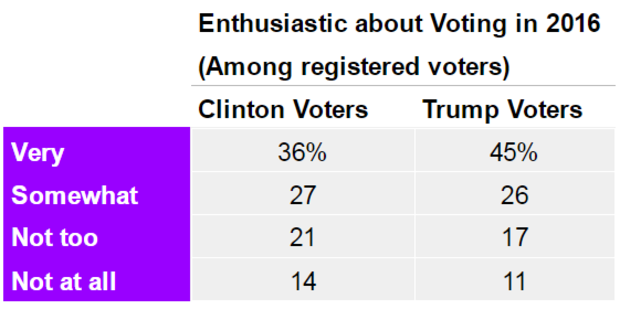
Thirty-six percent of registered voters overall now say they are very enthusiastic about voting, the same as a month ago. But one disadvantage for Clinton is that enthusiasm among Republican voters has remained steady, while enthusiasm among Democrats has dropped. Among Democratic voters, the percentage that is at least somewhat enthusiastic has dropped from 77 percent in August to 64 percent today, while the percentage of Democrats who are very enthusiastic has dropped nine points – from 47 percent to 38 percent.
More specifically, Trump supporters are more excited about voting than Clinton’s. Forty-five percent of Trump voters say they are very enthusiastic about voting, compared to 36 percent of Clinton backers who feel that way.
Just over half of each candidate’s voters say they strongly support their candidate, but for many, support is not so strong - including a quarter who are voting for their candidate because they dislike the other choice.
Who’s Supporting Whom?
Trump now garners support from just under nine in ten Republican voters, as does Clinton among Democrats.
A look at the candidates’ demographic support also illustrates why the race is close. A gender gap remains: Trump has a double-digit lead over Clinton among men, while Clinton is ahead by a similar margin among women. Trump continues to struggle with African American voters, but has an advantage over Clinton among whites.
Whites without a college degree are strong supporters of Trump (58 percent back him), while Clinton leads Trump among white voters with a college degree.
Clinton is ahead of Trump among voters under 30 but she is not getting the level of support Barack Obama received in 2012. 48 percent of young voters are currently backing her, while Obama won 60 percent of the young vote in 2012. Only 29 percent of young voters are supporting Trump, but 21 percent say they’ll vote for someone else or won’t vote.
This poll was conducted by telephone September 9-13, 2016 among a random sample of 1,753 adults nationwide, including 1,433 registered voters. Data collection was conducted on behalf of CBS News and The New York Times by SSRS of Media, PA. Phone numbers were dialed from samples of both standard land-line and cell phones.
The poll employed a random digit dial methodology. For the landline sample, a respondent was randomly selected from all adults in the household. For the cell sample, interviews were conducted with the person who answered the phone.
Interviews were conducted in English and Spanish using live interviewers.
The data have been weighted to reflect U.S. Census figures on demographic variables.
The error due to sampling for results based on the entire sample and the sample of registered voters could be plus or minus three percentage points. The error for subgroups may be higher and is available by request. The margin of error includes the effects of standard weighting procedures which enlarge sampling error slightly.
The sample of likely voters is modeled among registered voters (N=1,433), assigning each respondent a probability of voting based on their responses. The margin of error for the sample of likely voters is plus or minus three points.
This poll release conforms to the Standards of Disclosure of the National Council on Public Polls.
The Race for President by News Team on Scribd