Where do stocks go from here?
It's been an exciting couple of weeks for the financial markets as everything seems to be struggling for direction. One gets the feeling that a big break could happen, up or down.
Large-cap indexes like the Dow Jones industrial average and the S&P 500 recently set record highs and remain within a hair of those levels. But other measures such as the NYSE Composite and the Russell 2000 Small Cap indexes have been sliding lower.
Some commodities are stabilizing, while others, like iron ore and precious metals, have been moving lower.
And even in bonds, things are going a little haywire as Treasurys have bounced a little, while high-yield junk bonds have slid back to test their August lows.
This is most likely a function of the mixed outlook for the economy and cheap money stimulus. European and Chinese stocks have been weak because of their slowing economies, but their central banks have been pushing or are hinting at new stimulus measures. Here at home, job market data has been strong, but housing and inflation data have been a bit weak.
Also in the mix has been some pretty dramatic moves in the currency markets as the U.S. dollar has gone vertical and is on the cusp of returning to levels not seen since 2010.
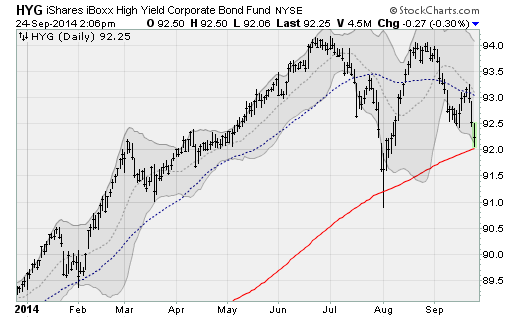
Some big technical support and resistance levels are also in play. In junk bonds, the iShares High Yield Bond Fund (HYG) is threatening to fall below its 200-day moving average -- a level that it hasn't lost in a big way since August 2013 (chart above). The Russell 2000 just suffered a "Death Cross" as its 50-day moving average dropped below its 200-day moving average for the first time since 2011.
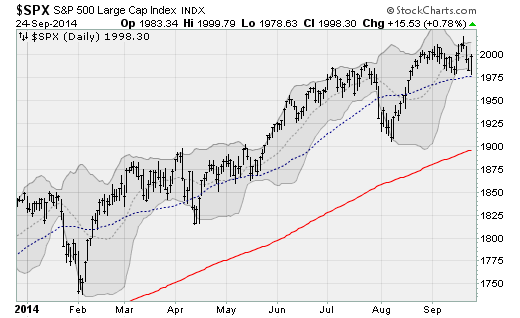
And on the upside, the S&P 500 looks like it could move back above the 2,000 level, a threshold it's been playing with since late August, after bouncing off of its 50-day moving average on Wednesday (chart below).
So, where do we go from here?
The folks at Yardeni Research -- who last September called for the S&P 500 to rise to 2014 this year -- are telling clients to prepare for three possible scenarios. Here they are, with Yardeni's odds of each happening:
Rational exuberance (60 percent)
This outcome would feature the U.S. economy continuing to grow at a solid pace with inflation subdued and the Fed raising interest rates sometime in 2015 but at a gradual pace. Stocks would be increasingly supported by higher earnings rather than higher valuations, with forward earnings growth of around 7 percent on the S&P 500. That would lead to a rise in the index to 2,300 by the end of 2015 -- a 15 percent gain from here.
Irrational exuberance (30 percent)
In this outcome, economic growth would remain the same as the first scenario, but the market goes into a valuation-led melt up in stock prices. The stronger dollar plays a role by attracting foreign capital into U.S. markets. Share buybacks support higher stock prices as the Fed slows the pace of its monetary normalization.
Endgame (10 percent)
In this outcome, the S&P 500's high of 2,018 on Friday might've been the tippy-top of this bull market as weakness in small-cap stocks spreads to the rest of the market. Economic slowdowns in Japan, Europe and China slam the brakes on the global economy. And we know that valuations are full with the S&P 500's price-to-earnings multiple at levels only exceeded heading into the 1929, 2000 and 2007 market tops. Other measures, such as equity market capitalization vs. GDP and Tobin's Q are both at levels not seen since late 2000.