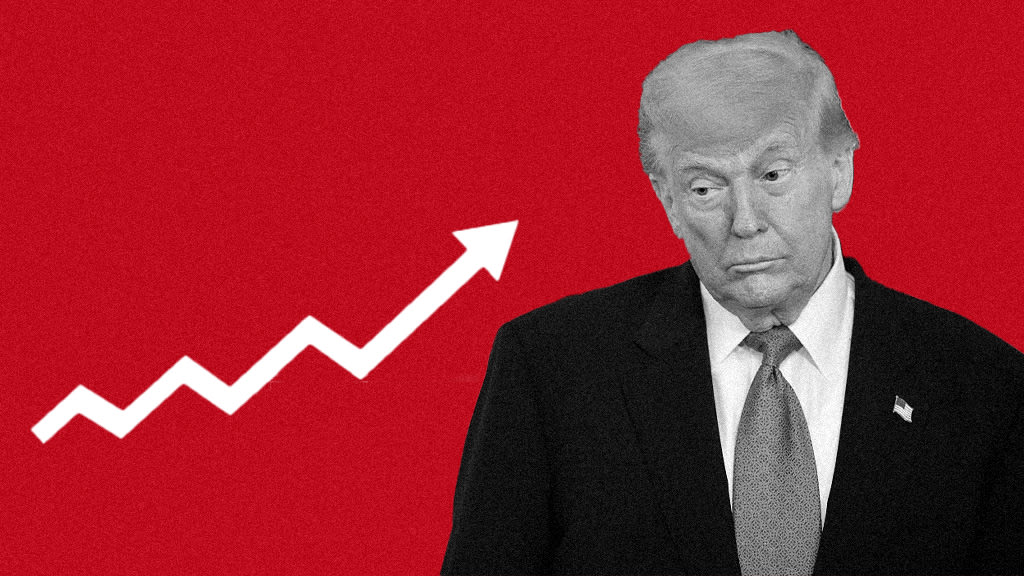
The Trump rally could be on its last leg
Wall Street has gone quiet. Two weeks after the Dow Jones industrials index pushed over the 20,000 level for the first time to great fanfare, volatility has collapsed, trading has been listless and everyone’s interest seems to lie elsewhere. Like: Did Lady Gaga’s Super Bowl performance have any hidden meaning?
The ennui is real. And that’s a letdown after the historic post-election uptrend fueled by euphoria over the surprise election of President Donald Trump. Initial excitement over positives like possible tax reform and pro-growth deregulation has given way to political acrimony in Congress, a divisive immigration clampdown and fears of an outright trade war.
With the holidays over and fourth-quarter earnings season largely a snore, it raises the question: Is the Trump rally over? If so, what comes next?
To be sure, the current situation is far from normal. Consider that large-cap stocks have gone 36 days without a 1 percent intraday move -- the longest such streak in history -- and 81 days without a 1 percent decline. January featured the narrowest trading range ever for the start of a year -- a far cry from last January’s worst-ever start to a year.
No surprise then that sentiment and investor positioning measures are extremely bullish.
Gluskin Sheff’s David Rosenberg highlights the latest Investors Intelligence survey, which shows that the bull camp has grown to a 19-month high of 61.8 percent of respondents, while the bear share is down to 17.6 percent. The spread between the two spiked to 44.2 from 40.7 the prior week, which “is in the danger-complacency zone,” according to Rosenberg.
Yet outside of equities, the recent tranquility has already been broken.
Bond yields are declining again. Gold is firming up. The dollar is back in rally mode. High-yield bond spreads, a measure of risk appetites, are widening. And on Tuesday, crude oil closed below its 50-day moving average (a measure of medium-term trend) for the first time since December amid bearish inventory data and lagging measures of demand.
Even inside the stock market, you can find evidence of weakness if you know where to look.
Consider that on Tuesday, according to Jason Goepfert at SentimenTrader, the total volume for positive securities was 1.1 billion shares, while declining issues had a whopping 2.2 billion. Still, large-caps overall posted a modest 0.2 percent gain on the day.
Goepfert checked his database for this rare occurrence of narrow buying interest -- which is exceedingly rare with stocks so near a record high. Looking back at the six such prior instances that have occurred since 2009, every one was followed by a market decline over the two months afterward, with an average loss of 3.4 percent.
The last two instances were in July 2015 and were followed by losses of more than 6 percent.
Adding to the bad news is the historically poor performance stocks have demonstrated in February, especially in a post-election year. According to LPL Financial, since 1950 the S&P 500 index has gained a February average of just 0.03 percent and rose just 55 percent of the time. During post-election years, the average return drops to a loss of 1.8 percent, for the single worst month of the year.
Still, any volatility and weakness could prove ultimately to be a buying opportunity for stock investors, depending on the tone and tempo of Mr. Trump’s policy implementation, the pace of rate hikes from the Federal Reserve and the quickness with which Congress acts on proposed tax cuts.
But for now, at least, investors should resist the urge to let things ride and consider taking some risk off the table.