A Closer Look At The National Climate Assessment
Find Eric Fisher on Twitter and Facebook
The most frustrating thing when it comes to talking about our climate? Talking about our climate. Over the years it has taken on this political slant that now seems impossible to avoid, and it sends people into orbit when you simply give them some observed numbers or show a trend. There are few issues out there that have become so polarizing. As someone who works in the broadcast media, I can tell you that merely running ANY story that mentions climate in a newscast immediately leads to tweets/emails responding to it. There's nothing else we do that draws that kind of reaction. Trust me folks, it's possible to be a scientist without being a politician. I personally couldn't care less about politics.
That leads us to the big talker of the past 24 hours. The National Climate Assessment is released every 4 years, and the latest edition, with the help of hundreds of scientists, was released on Tuesday. Below are some of the details that are in the 800+ page report. I took out a couple that I found interesting, and this is a 'timeline' of the tweets I sent out after reading parts of the report.
You can argue, as is the case with any dealing in statistics, that start/end dates can be manipulated to show data differently. Both 'sides' of the climate issue use this tactic at times. But in my weather career I can certainly say that the world is getting warmer, that CO2 concentrations are higher than any human being has ever seen, and that we're more vulnerable to extreme weather. I can also say with high confidence that there are many, many, many other drivers of our climate than CO2 and human activity alone.
A BIG reason we're more vulnerable to extreme weather is due simply to population, wealth, and infrastructure growth. Consider a scenario where the weather stays exactly the same for the next 300 years. Even in that world, more people will be impacted by the same storm as time passes, because more will be in its path. The world's population is exploding. Even here in New England, where there hasn't been a huge change, a hurricane on par with 1938 would be so utterly devastating and lead to such a higher cost now. Look at Sandy, a mere (barely) Category 1 storm as it came ashore and all the havoc it caused due to its highly urbanized landing zone.
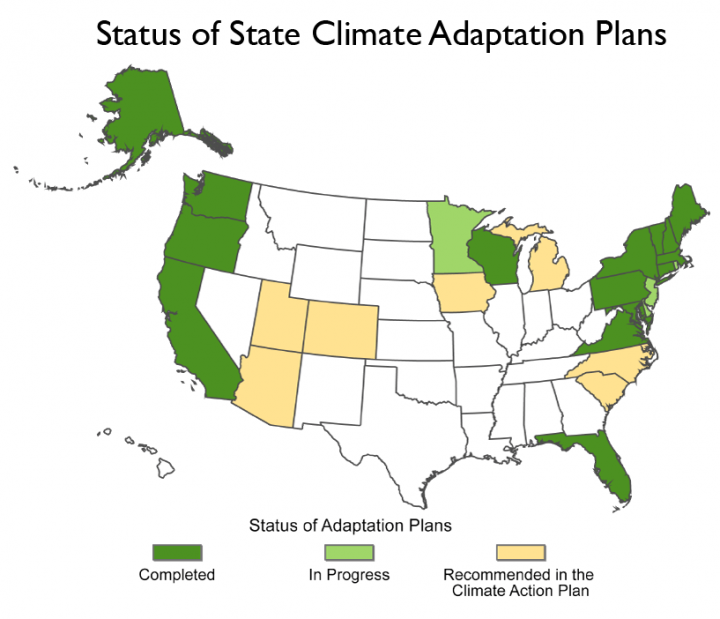
In any case, I do think there are challenges ahead, and of course that weather will continue to change as it always does. To just sit and wait for things to change on us would be a mistake, especially if there are easy steps we can take to help our cause. There's good new for those of us in the Northeast - nearly the entire region has adaptation plans in place! Along with the West Coast and a few others, steps are being made to be prepared for whatever may come our way in the future.
1958-2010 - The NE has experienced a greater recent increase in extreme precipitation than any other region in the US pic.twitter.com/97kXswF4TI
— Eric Fisher (@ericfisher) May 6, 2014
This first map shows the significant increase in extreme precipitation events, and you can see the Northeast really sticks out in this regard. 'Extreme precipitation events' are the top 1% of rain events, so we're talking about the worst and most unusual of storms becoming even more water-laden. The tipping point that brings about major flooding doesn't have to be 4" of rain...around the Northeast and across our rocky terrain a much smaller amount can be the difference.
Sea-level rise noted as one of the biggest #climate threats to the Northeast region. #NCA2014 pic.twitter.com/KloTSWZuKg
— Eric Fisher (@ericfisher) May 6, 2014
Sea level rise is something we're all wary of, considering how much of our lives take place along the Atlantic. Again, it doesn't take too much to have an impact. Take NYC as an example. During Sandy, we all know what happened. But during Irene, water levels were extremely close to doing the same thing. Just about 1' more and water would have inundated subways and tunnels. So 1' higher seas could make borderline storms become major storms.
OCEANS: Trends between rising CO2, sea levels, SSTs, and pH levels. #NCA2014 pic.twitter.com/XtACzVBK0d
— Eric Fisher (@ericfisher) May 6, 2014
An argument exists (rightfully) about CO2 and temp trends. If CO2 keeps going up, how come temperatures don't exactly follow suit? For one, there's more at work in our atmosphere than just CO2. But our oceans are also a big player. They absorb massive amounts of CO2, and at a cost. The pH trend here is particularly alarming to me. Anyone who is a diver can tell you about the sad state of reefs and wildlife in our oceans. I've gone diving in Mexico, the Caribbean, Thailand, and Australia personally - and Australia held the only reefs still alive and growing. Polluted and increasing acidic seas are a major threat to ecology.
Increase/decrease in river flooding magnitude (1920s through 2008). #NCA2014 pic.twitter.com/qWn3SXa6bu
— Eric Fisher (@ericfisher) May 6, 2014
The overall trend, and it matches up well with increasing extreme precipitation events, is for larger flood events in the Midwest and Northeast. Meanwhile in the west, rain and snow have been very hard to come by.
Where are many Americans moving to? The west. Where is the greatest water stress in the U.S.? The west. #NCA2014 pic.twitter.com/MEjdGmqW31
— Eric Fisher (@ericfisher) May 6, 2014
This map sticks out to me more than perhaps all the rest. California is mired in an epic and historic drought, and many states are at their driest point since the Dust Bowl years. The reason this resonates so much with me is that population growth is booming in these areas. So many Americans are moving to the west, but this is where resources are extremely tight. An extended period of drought could have extreme impacts on people living in these areas. There simply isn't enough water for all the people who want to live here, especially if these cities continue to grow at their current pace.
A look at CO2 emission trends across industrialized nations, via European Commission Joint Research Centre. pic.twitter.com/tdOpAJ70tV
— Eric Fisher (@ericfisher) May 6, 2014
For a long time, the U.S. was the biggest CO2 emission offender. But it's not the case anymore, and China is running away with it. The amount of coal plants going online every year in China is mind boggling, and this highlights the fact that pollution/climate change is a global issue. We can't do it alone.
So far in 2014, global temperatures just a bit above average (with pockets of big +/- departures, U.S. included) pic.twitter.com/4NZ1enB0ca
— Eric Fisher (@ericfisher) May 6, 2014
Just a last note - global temperatures anomalies so far in 2014. The single, most difficult thing to get across when discussing climate is that what's happening over your head, or even in your country, is miniscule in the overall picture. Sure, the winter was absolutely frigid and snow filled here in the eastern U.S. But even when we hit a big cold streak, we can easily be balanced across the whole of the Earth.