Stocks are flashing red, as these key signals show
The stock market has been running in place since December. That's when the Dow Jones industrial average first hit the 18,000 level, a level that it's still struggling to stay above.
And beneath the surface, stocks are weaker than they appear -- much weaker. The Dow Jones U.S. utilities index is down more than 16 percent from its January high. The Dow Jones transportation average is down nearly 12 percent. Just 62.5 percent of the stocks in the S&P 500 are in uptrends, compared to 75 percent as recently as April.
For a variety of reasons, a growing number of sector groups are rolling over into downtrends. That suggests the broader market is increasingly vulnerable to a correction of the type we haven't seen in months.
Utility stocks have been hit by rising long-term interest rates, as the bond market prices in higher inflation, stronger economic growth and the approach of the Federal Reserve's first interest rate hike since 2006. That's because their valuation is very sensitive to changes in yields, since their dividends are such an important part of their total return appeal.
Transport stocks usually would benefit from the combination of faster economic growth and lower energy prices. But instead, as revenue growth for companies in the sector stalls, investors are bailing out.
Energy stocks have been drifting lower since April -- despite stability in crude oil near $60 a barrel -- as investors realize that the temporary support provided by the summer driving season has encouraged a surge of production increases from U.S. shale producers and Saudi Arabia. When autumn arrives, inventories will swell and prices are likely to weaken.
Real estate stocks are coming under pressure as well -- threatening to fall below their June low to return to levels not seen since October -- as they too are sold off in response to rising long-term interest rates. Real estate stocks, mainly real estate investment trusts, are also sensitive to yields.
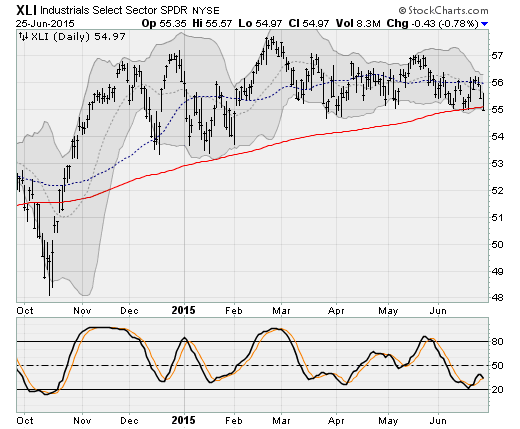
And finally,on Thursday, the core of the stock market -- industrial stocks -- rolled down and out of a consolidation range going back to November. With that, the Industrial Sector SPDR (XLI) closed below its 200-day moving average for the first time since October.
This rollover in market breadth is summarized by a number of technical indicators, such as the McClellan Oscillator and Summation Index. Jason Goepfert at SentimenTrader highlighted in a note to clients that for the first time since 1999, these two indicators turned negative just a few days after the S&P 500 hit a new 52-week high.
Here's the thing: Over the past 75 years of market history data, such divergences between price and breadth have led to poor returns over the medium term. In his words, the most persuasive interpretation of the data is that "this is another sign of a market that is struggling beneath the big indexes that are hitting new highs."

