Why Wall Street's post-Brexit surge is at risk
U.S. equities fell again on Thursday as long-term government bonds came under selling pressure -- a dynamic, related to “risk parity” strategies, that hit markets back in September.
The 10-year Treasury yield increased five basis points to 1.84 percent as prices fell (yields and prices move in opposite directions) and on indications of some better global economic growth and rising inflation in the U.S. (health care, energy and shelter costs) could become a growing problem in months to come.
The bad news continued after the close as big-tech momentum sweetheart Amazon (AMZN) fell more than 5 percent in extended trading after reporting weaker-than-expected earnings of 52 cents per share vs. the consensus of 85 cents. Forward guidance was also weak.
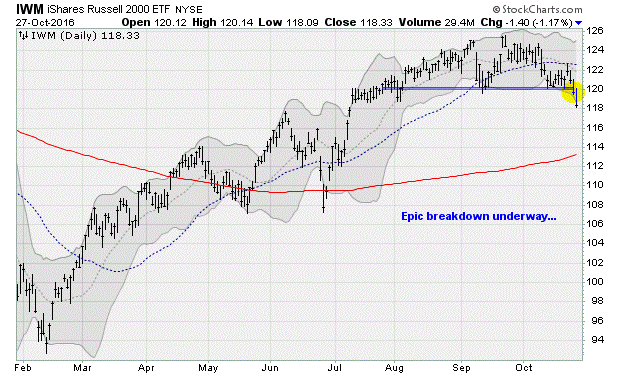
After weeks of slumping market internals, as breadth -- or the percentage of stocks moving higher -- steadily declined, small-cap stocks have now collapsed out of a four-month trading range back to early July levels (chart below).
This puts the entire post-Brexit surge at risk, thanks to concerns including political jitters over the U.S. presidential election, the specter of a December rate hike from the Federal Reserve, tepid U.S. economic data and an ongoing slide in corporate earnings.
Add to this renewed pressure on U.S. Treasury bonds, and the odds of a meaningful market correction have risen substantially.
That isn’t to say there haven’t been some bright spots. Alphabet (GOOGL) delivered a positive surprise after Thursday’s close, reporting better-than-expected earnings of $9.06 per share vs. the consensus of $8.58 on $22.5 billion in revenue, up 20 percent from last year. Or the fact that the Nasdaq 100 clipped a new intraday high on Tuesday.
But that superficial strength belies underlying weaknesses. Jason Goepfert at SentimenTrader noted that while the Nasdaq 100 hit a new high, the 10-day average of the ratio of new highs to new lows has sunk below 50 percent. Translation: More stocks on the tech-focused exchange are setting new one-year lows than one-year highs.
The last time this happened was right before the broad market sell-off last summer.
Another odd market development: The small-cap weakness is coming just after the S&P 500 lingered, at length, just below its all-time highs. Specifically, the last new top for the S&P 500 was on Aug. 15, and since then the index has remained within 3 percent of that level -- a remarkable sideways run.
In fact, that has rarely happened for this long before. Two prior occurrences, as Goepfert pointed out, preceded large corrections of more than 10 percent in 1965 and 1993.

