What whelks and oysters teach us about investing
(MoneyWatch) Investors are waking up to the fact that while past performance of mutual funds has no value for predicting future performance, expense ratios are a very good predictor -- lower cost funds persistently outperform. But expense ratios aren't the only cost of owning a mutual fund.
You may never have heard of a whelk, but this little ocean creature can ruin an oyster's day. A whelk looks like a conch, only smaller, and is equipped with a tentacle that works like an auger. The little whelk will drill a very small hole in the top of the oyster's shell. Through this hole a whelk can devour an entire oyster, sucking it out little by little until the oyster is gone.
Mutual fund expenses are the little whelks doing damage to your portfolio. Because most investors aren't aware of all the costs of a fund, they make the mistake of focusing exclusively on the expense ratio. Unfortunately, the fund's expense ratio can be a relatively small portion of the total expenses. The other expenses are:
- Commissions
- Bid-offer spreads
- Market impact costs -- When a fund buys or sells a large block of stock, its purchases or sales cause the stock to move beyond its current bid (lower) or offer (higher) price, increasing the cost of trading.
- Taxes -- For taxable accounts, taxes can easily be the largest expense. The burden of taxes is so great that Ted Aronson of Aronson Johnson Ortiz, an active manager with over $20 billion in assets under management stated: "None of my clients are taxable. Because, once you introduce taxes... active management probably has an insurmountable hurdle."
- Cost of Cash -- Since, over the long term, stocks have provided a higher return than cash (or the equivalent of one-month Treasury bills), holding cash in an effort to time the market reduces returns. A study by Russ Wermers found that nonstock holdings reduced returns for the average actively managed stock fund by 0.7 percent.
There's one other factor that investors miss if they focus solely on the expense ratio. Mutual funds can generate revenue through the practice of securities lending -- the short-term loan of stocks to hedge funds and other institutional investors who are borrowing to short the stock. When selling a stock short, an investor borrows shares and sells them immediately on the assumption they'll fall in value and can be returned at a lower cost. The borrower pays a fee for the loan, and must provide the fund collateral equivalent to 102 percent of the loan. A mutual fund generates revenue from the activity by charging a securities lending fee. Mutual funds typically use a custodian to facilitate the lending. The mutual fund then shares the borrowing fees with the custodian -- the better the fund negotiates the revenue split, the more its shareholders benefit. In addition, the smaller the available supply of stock to borrow, and the greater the demand, the higher the fee the fund can charge.
Securities lending revenue is used to offset the fund's expenses. Thus, a better measure of the cost of a fund than the expense ratio is what we can call the "net expense ratio." Let's take a look at similar passively managed funds and see how much of a difference their securities lending activities can make. We'll look at three fund families that provide passively managed small-cap funds: Bridgeway, Dimensional Fund Advisors (DFA) and Vanguard. Vanguard has two versions of each of their funds, the regular version and a lower cost version (Admiral or Signal shares) that is available to investors who meet certain asset minimums.*
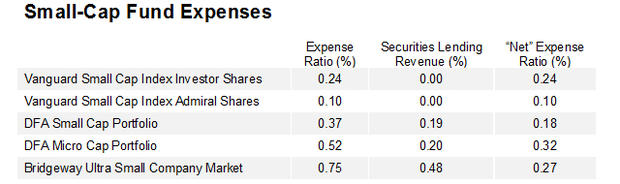
When we look at the small-cap funds, we see that Vanguard has by far the lowest expense ratio. However, once we take into account securities lending revenue, the picture is different. When we look at the regular version of Vanguard's Small Cap Index Fund (NAESX), we see that both its gross and net expense ratios are 0.24 percent -- the revenues it generates from securities lending is so small that it rounds to zero. DFSTX has an expense ratio of 0.37 percent, but the 0.19 percent securities lending revenue it generates results in a net expense ratio of just 0.18 percent, lower than NAESX's, though still higher than the 0.10 percent net expense ratio of VSISX. Thus, it has a much lower hurdle to overcome in its attempt to add value sufficient to overcome its higher expense ratio.
Because of the 0.48 percent BRISX generates in securities lending revenue, its 0.75 percent gross expense ratio doesn't look so daunting as it results in a net expense ratio of a very reasonable 0.27 percent, just 0.03 percent higher than NAESX's and 0.17 percent higher than VSISX's.
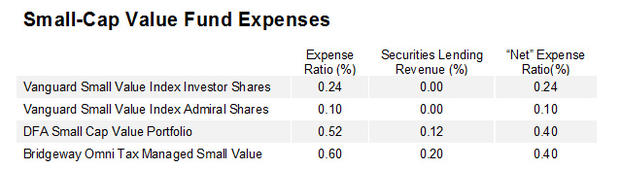
When we look at the small value funds, we see a similar story, though the securities lending revenues generated by DFA and Bridgeway aren't as great, leaving a wider gap to overcome.
The bottom line is that when choosing a mutual fund, in addition to considering its expense ratio you should also make sure you consider its:
- Turnover
- Average cash holdings
- Tax efficiency
- Securities lending revenue
- Weighted average market capitalization (which determines its exposure to the small stock risk factor)
- Weighted average book-to-market or P/E ratio (which determines its exposure to the value stock risk factor)