Brexit likely hasn't finished bashing the market
U.S. equities enjoyed a rebound on a classic Turnaround Tuesday after chatter of a possible coordinated central bank policy response to financial market turbulence bolstered sentiment overnight. It also helps that after a few days of post-Brexit panic, stocks were really oversold.
According to the Bespoke Investment Group, the S&P 500 was more than three standard deviations below its 50-day moving average as of Monday's close -- its most oversold level since January. Moreover, four S&P 500 sectors -- consumer discretionary, financials, industrials and materials -- were also that much below their 50-day averages.
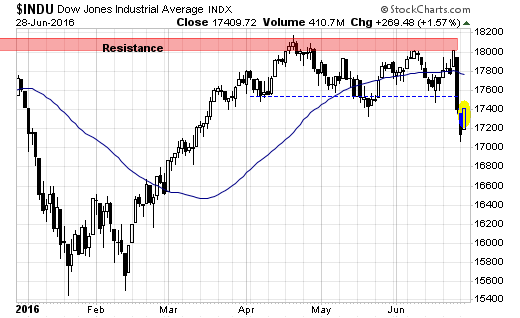
Yet the medium-term downtrend looks intact as the large-cap stocks have broken down out of a four-month consolidation range on big volume (chart below).
The repercussions of the Brexit vote have yet to be fully revealed. And any policy response from central bankers will be limited by the fact they have already thrown so much at the tepid, post-financial crisis recovery.
The big news of the day came in the comments by European Central Bank chief Mario Draghi at a forum in Portugal that divergent monetary policies by the major central banks could create uncertainty about future policy intentions, which in turn, could exacerbate currency market volatility (which has been the epicenter of the post-Brexit fallout).
This was interpreted as a hint that coordinated action was forthcoming should financial market losses continue. Also helping were reports that the Japanese government and the Bank of Japan would hold a policy meeting on Wednesday morning.
But a survey of indicators showing where markets stand suggests the situation remains vulnerable to further downside extension and bigger losses.
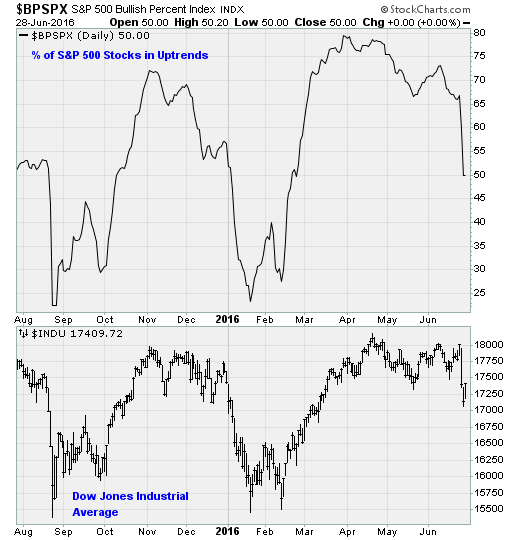
For one, while the stock prices have indeed fallen hard (lower chart above), other measures are far from the lows seen back at the August and January-February market lows. Consider market breadth, or the percentage of S&P 500 stocks in uptrends (upper chart above). The indicator has indeed fallen off a high of near 80 percent back in March to just 50 percent now. Lows near 20 percent were seen recently. Buyers are finding fewer stocks they like here, but they haven't reached the depths of despair just yet.
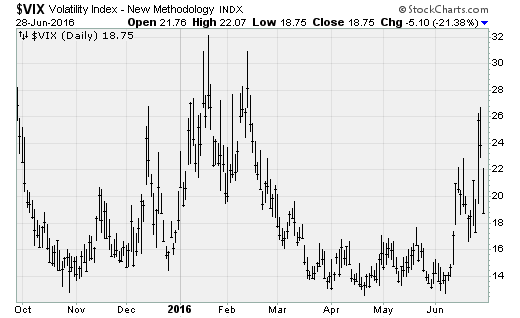
Two, fear as indicated by the CBOE Volatility Index (VIX) -- which measures how much options traders are willing to pay for downside hedges -- remains elevated but well off of the highs seen earlier this year (chart above). This means investors are still very interested in protection instead of outright profits.
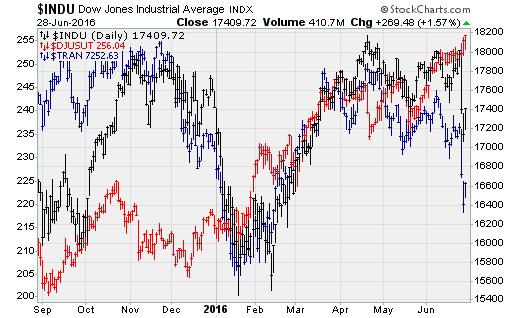
Three, the "Dow Theory" suggests caution as transportation stocks (the blue line in chart above) have weakened significantly over the past few months while investors pile into defensive utility stocks (red line). Because of their key role in the industrial supply chain, transport stocks are widely believed to provide an early indication on the health of the economy and thus, stocks. (The Dow Jones industrials index is in black above.)
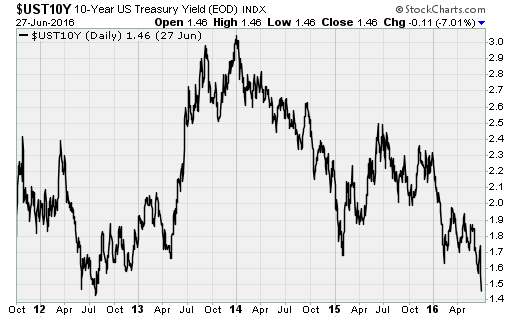
And four, the collapse in long-term Treasury bond yields to levels not seen since 2012 is a loud and clear warning from the bond market that all is not well (chart above). The decline in yields started in December, when the Federal Reserve raised its policy interest rate for the first time since 2006.
Until these indicators turn around, investors would do well to remain cautious and focus on safe havens such as T-bonds, precious metals and even cash.