9 U.S. states with the highest income inequality
Income inequality is sometimes considered to be a problem plaguing wealthy American communities like San Francisco, where the gap between rich and poor has been compared with that of developing nations like Rwanda.
But it turns out that every state in the country is experiencing the impact of the trend, which is lifting the fortunes of the rich while leaving the rest of the country's workers behind. Since the 1970s, inequality has widened in every state, and since the Great Recession, many states have seen even wider gaps between the top 1 percent of income earners and the bottom 99 percent, according to a new study published by the left-leaning think tank Economic Policy Institute.
It found the top 1 percent of Americans captured 85.1 percent of total income growth between 2009 to 2013, which means the bottom 99 percent of workers failed to share in the fruits of the recovery to the same extent. A myriad of potential problems can develop with a winner-takes-all economy, ranging from weaker consumer spending to a lack of social mobility for poor and middle-class children. On top of that, workers can become discouraged if the economy doesn't reward employment fairly.
"I'm deeply concerned that if we see this growth in income inequality, it will translate into undermining what I think is the hallmark of American society," the ability to climb the socio-economic ladder, said Mark Price, a labor economist with Keystone Research Center and a co-author of the report. "Poor children aren't necessarily born with less ability. This could mean that those kids don't get the means to achieve their potential."
In economies where most of the income gains are at the top, productivity growth may end up slowing, he added: "When income was growing for everyone, productivity growth was stronger."
Specific industries may fuel wider income inequality, such financial services, where some top employees can receive multimillion paychecks. Yet the countrywide trends toward greater inequality hints that other ubiquitous issues are touching every community. Economists frequently debate the causes, although Price said he believes one of the significant changes since the 1970s is the decline of union employment.
"The absence of collective bargaining means that even though productivity is growing and the economy is growing, it's not ending up in worker's paychecks like you would expect," Price explained.
Another issue is the erosion of the federal minimum wage, which has hasn't changed from $7.25 an hour since 2009. Even in 2009, the minimum wage was 7.8 percent below its 1967 value, the EPI has found.
Then there are shifts in what society considers to be acceptable in the corporate world. Forty years ago, it may have been unheard of for a CEO to earn a huge salary and bonus while laying off workers, but that doesn't raise eyebrows now. Top executives in the financial sector are more aggressive and expect higher pay packages in return, Price noted.
He added, "Cultural norms have changed. It's made that income growth at the top more palatable."
The EPI study's methodology relies on tax data reported by the IRS for states and counties. The analysis examines income earned through jobs, interest or selling a financial asset, although it excludes the impact of taxes and government benefits.
Read on to learn about the nine U.S. states where income inequality is widest.
9. New Jersey
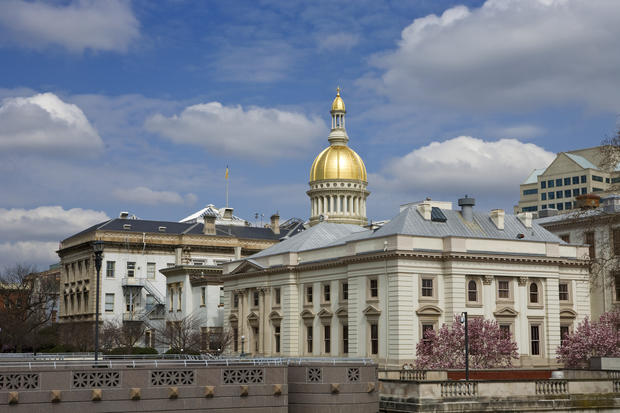
Incomes for the 1 percent are growing bigger in the Garden State. The state's widening inequality is a trend that the nonprofit analysis group New Jersey Policy Perspective called "disturbing" earlier this year.
New Jersey ranks as one of the 10 states where the top 1 percent's share has jumped the most from 1979 to 2013, which is largely due to the presence of financial sector employees.
It's also one of the 15 states where the top 1 percent captured all income growth between 2009 to 2013. The bottom 99 percent actually lost income during the recovery, showing a decline of 1.4 percent.
The average income of the top 1 percent of New Jersey's earners was $1.45 million in 2013. By comparison, the average income of the bottom 99 percent stood at $57,447 during the same year. The top-to-bottom ratio is 25.3, which is also the same ratio for the U.S. as a whole.
To make it into the top 1 percent in New Jersey, a family needs to earn at least $547,737, the study found. To enter the ranks of the 0.01 percent, New Jerseyians would need to earn $9.9 million annually.
8. Texas

The rich are growing richer in the Lone Star State, where the top 1 percent captured 63 percent of the income gains during the recovery.
The average income of Texas' top 1 percent stood at $1.3 million in 2013, compared with $48,899 for the bottom 99 percent, the study found. That gives the state a top-to-bottom ratio of 26.9, also higher than the U.S. average.
Several cities within Texas rank high for income inequality as well, the researchers found. Midland, Texas -- in the heart of oil country -- has a top-to-bottom ratio of 44.3, making it the American city with the eighth-biggest rate of income inequality. The top 1 percent in Midland make an average of $3.36 million a year, compared with $75,980 for the rest of its residents.
So what does someone need to earn to enter the top 1 percent in Texas? The threshold is $424,507, the report found. To reach the top 0.01 percent, a household needs to earn at least $9.55 million annually.
7. California
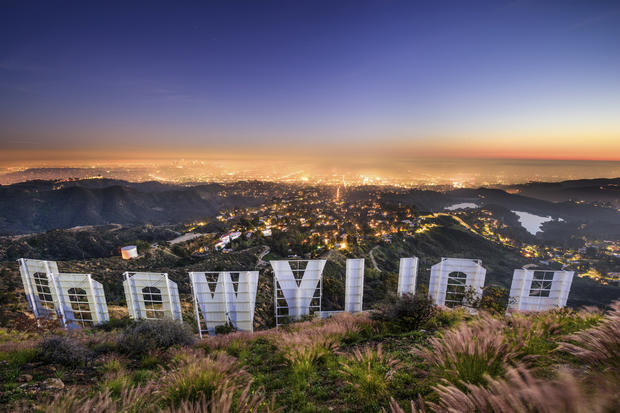
The average income of the top 1 percent in California stood at $1.4 million in 2013, compared with $48,899 for the bottom 99 percent. That gives the state a top-to-bottom ratio of 28.9.
Income inequality is a hot-button topic in California, where the tech industry has rewarded young, educated workers while leaving many others behind. Wealthy tech workers have been criticized for a lack of empathy for those who are struggling or homeless. That came to a head earlier this year when one tech entrepreneur wrote a letter to San Francisco's mayor complaining that he shouldn't have to see the "despair of homeless people" while commuting to work.
Entering the ranks of the top 1 percent in California requires at least $453,772, while the top 0.01 percent have an income threshold of $10.5 million, the study found.
6. Massachusetts

The Spirit of America also embodies the problems of income inequality. The average income of the top 1 percent is $1.69 million, while the bottom 99 percent earn $56,115. That gives the state a top-to-bottom ratio of 30.2.
This tech-heavy state is also struggling to provide enough affordable housing, an issue that Gov. Charlie Baker wants to address by spending $1.1 billion over the next five years on creating or preserving thousands of affordable apartments.
The income threshold for the top 1 percent is $539,055, while for the top 0.01 percent it's $12.7 million, the study found.
5. Florida
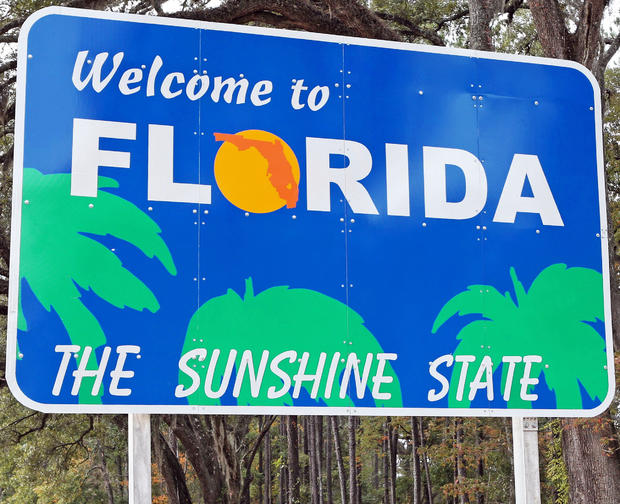
Thanks to retirees flocking to wealthy towns such as Naples and Key West, Florida ranks as one of the states with the fifth-largest level of income inequality.
The average income of the top 1 percent is $1.27 million, while the bottom 99 percent earn an average of $36,530. That gives Florida a top-to-bottom ratio of 34.7.
Entering the top 1 percent requires annual income of at least $385,410, while the threshold for the top 0.01 percent is $9.5 million.
4. Nevada

Nevada's top 1 percent earn an average of $1.39 million annually, while the state's 99 percent pull in an average of $36,169 per year. That provides Nevada with a top-to-bottom ratio of 38.3, or the fourth highest in the country.
Many of the state's richest residents have ties to the gaming industry, such as billionaire casino owner Sheldon Adelson. The richest residents of Nevada weathered the last recession better than poorer residents, who had more of their wealth tied up in housing and were hurt more by the state's real estate collapse.
The threshold for joining the 1 percent in Nevada is $311,977, while entering the top 0.01 percent will require at least $10.9 million.
3. Wyoming
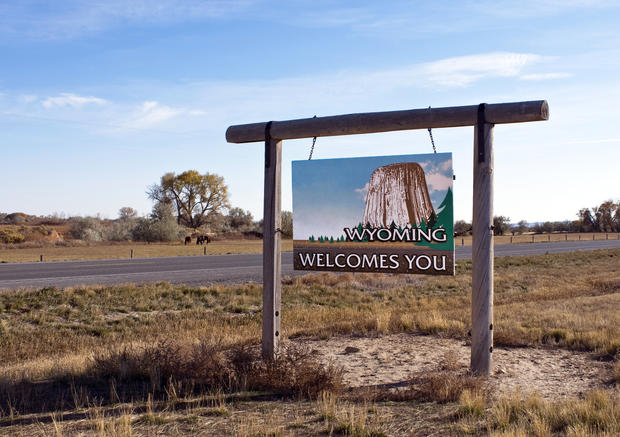
Wyoming may be known as the Equality State, but in reality it's now one of the country's most unequal, at least when it comes to incomes.
The average income of the top 1 percent stood at $2.1 million in 2013, while the bottom 99 percent pulled in an average of $52,196, giving the state a top-to-bottom ratio of 40.6, the third-highest in the country.
Some of Wyoming's towns are popular with wealthy Americans. Take Jackson, where the average income of the top 1 percent is roughly $20 million. That ranks the Jackson metropolitan area as the American city with the highest level of income inequality, with a top-to-bottom ratio of 213, or more than twice that of the runner-up, the Bridgeport-Stamford-Norwalk, Connecticut, metropolitan region.
Billionaires such as Walmart heir Christy Walton and Forrest Mars Jr., an heir to the Mars candy fortune, are Wyoming residents.
To enter the top 1 percent in Wyoming requires income of at least $368,468, while the threshold for the top 0.01 percent is $16.3 million.
2. Connecticut
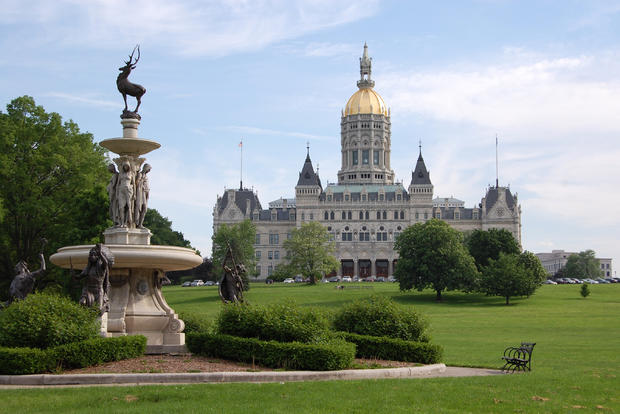
Home to hedge funds and financial executives, Connecticut is no stranger to income inequality.
The average income of the top 1 percent stood at $2.4 million in 2013, while the bottom 99 percent earned an average of $56,445, the study found. That gives Connecticut a top-to-bottom ratio of 42.6, making it the second-most unequal state in the country.
To enter the top 1 percent requires at least $659,979 in annual income, while the top 0.01 percent earn at least $18.7 million.
The richest residents in Connecticut include hedge fund executives such as Steve Cohen and Stephen Mandel.
1. New York

The Empire State stands at the pinnacle when it comes to income inequality.
Home to Wall Street, New York illustrates the striking divergence between the incomes of the top 1 percent and the bottom 99 percent. Residents in the richest slice of the state earned an average of $2 million in 2013, compared with an average of $44,163 for the bottom 99 percent.
That gives New York a top-to-bottom ratio of 45.4, tops in the country.
Income inequality is even starker in the county of New York (Manhattan), where the ratio is 115.6, making it the American county with the fourth-highest level of inequality. (The county with the highest inequality is Teton, Wyoming, where the ratio is 233.)
The income threshold for New York state's top 1 percent is $517,557, while joining the top 0.01 percent requires at least $15.8 million in annual income.
The incomes of the top 1 percent rose almost 21 percent from 2009 to 2013, while the bottom 99 percent saw their incomes slip 3.9 percent during the same period, the report found.